29
/
en
AIzaSyAYiBZKx7MnpbEhh9jyipgxe19OcubqV5w
April 1, 2024
180343
Libya
LBY
true
2
1
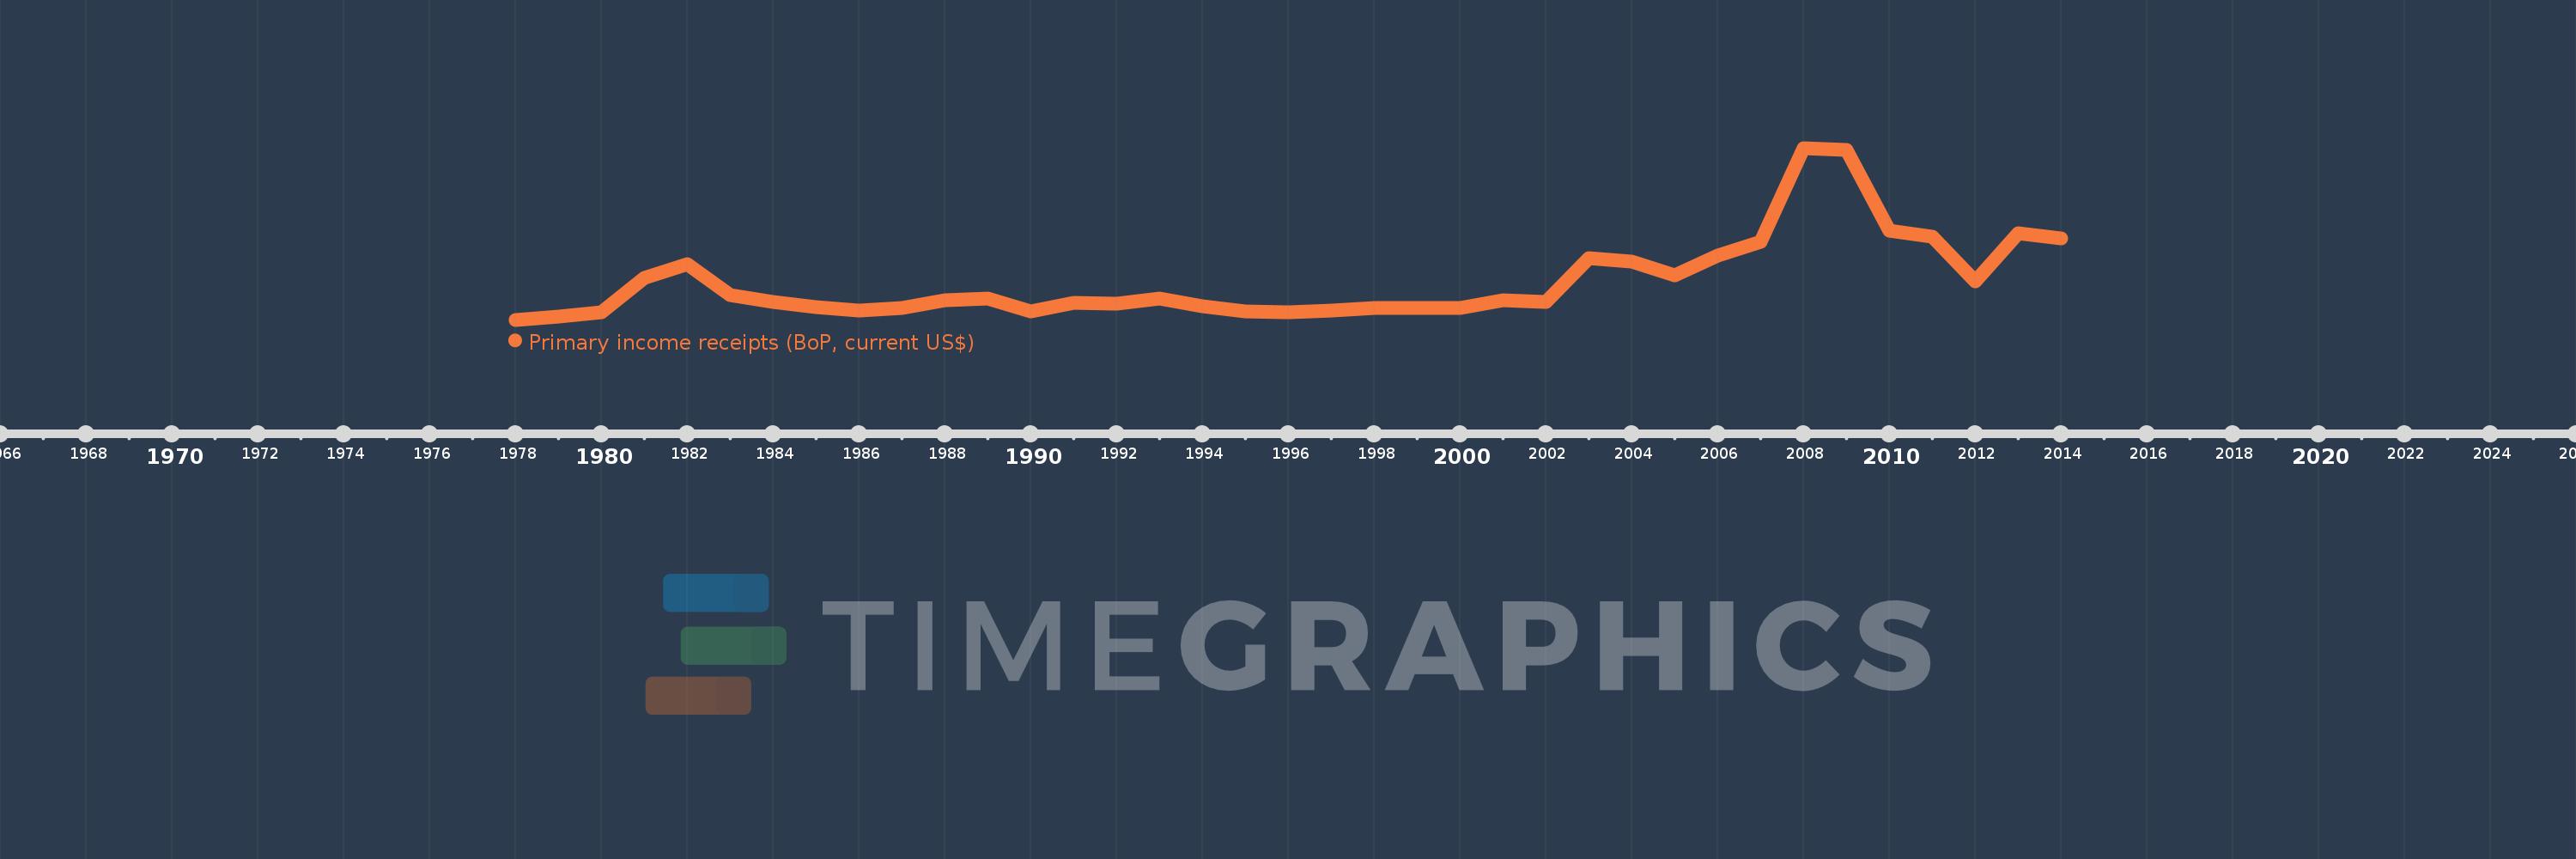
Primary income receipts (BoP, current US$)
2014,2013,2012,2011,2010,2009,2008,2007,2006,2005,2004,2003,2002,2001,2000,1999,1998,1997,1996,1995,1994,1993,1992,1991,1990,1989,1988,1987,1986,1985,1984,1983,1982,1981,1980,1979,1978
This statistics in other country:
AfghanistanAlbaniaAlgeriaAngolaAntigua and BarbudaArab WorldArgentinaArmeniaArubaAustraliaAustriaAzerbaijanBahamas, TheBahrainBangladeshBarbadosBelarusBelgiumBelizeBeninBermudaBhutanBoliviaBosnia and HerzegovinaBotswanaBrazilBrunei DarussalamBulgariaBurkina FasoBurundiCabo VerdeCambodiaCameroonCanadaCaribbean small statesCentral African RepublicCentral Europe and the BalticsChadChileChinaColombiaComorosCongo, Dem. Rep.Congo, Rep.Costa RicaCote d'IvoireCroatiaCuracaoCyprusCzech RepublicDenmarkDjiboutiDominicaDominican RepublicEarly-demographic dividendEast Asia & PacificEast Asia & Pacific (excluding high income)East Asia & Pacific (IDA & IBRD countries)EcuadorEgypt, Arab Rep.El SalvadorEquatorial GuineaEritreaEstoniaEthiopiaEuro areaEurope & Central AsiaEurope & Central Asia (excluding high income)Europe & Central Asia (IDA & IBRD countries)European UnionFaroe IslandsFijiFinlandFragile and conflict affected situationsFranceFrench PolynesiaGabonGambia, TheGeorgiaGermanyGhanaGreeceGrenadaGuatemalaGuineaGuinea-BissauGuyanaHaitiHeavily indebted poor countries (HIPC)High incomeHondurasHong Kong SAR, ChinaHungaryIBRD onlyIcelandIDA & IBRD totalIDA blendIDA onlyIDA totalIndiaIndonesiaIran, Islamic Rep.IraqIrelandIsraelItalyJamaicaJapanJordanKazakhstanKenyaKiribatiKorea, Rep.KosovoKuwaitKyrgyz RepublicLao PDRLate-demographic dividendLatin America & Caribbean Latin America & Caribbean (excluding high income)Latin America & the Caribbean (IDA & IBRD countries)LatviaLeast developed countries: UN classificationLebanonLesothoLiberiaLibyaLithuaniaLow & middle incomeLow incomeLower middle incomeLuxembourgMacao SAR, ChinaMacedonia, FYRMadagascarMalawiMalaysiaMaldivesMaliMaltaMarshall IslandsMauritaniaMauritiusMexicoMicronesia, Fed. Sts.Middle East & North AfricaMiddle East & North Africa (excluding high income)Middle East & North Africa (IDA & IBRD countries)Middle incomeMoldovaMongoliaMontenegroMoroccoMozambiqueMyanmarNamibiaNepalNetherlandsNew CaledoniaNew ZealandNicaraguaNigerNigeriaNorth AmericaNorwayOECD membersOmanOther small statesPacific island small statesPakistanPalauPanamaPapua New GuineaParaguayPeruPhilippinesPolandPortugalPost-demographic dividendPre-demographic dividendQatarRomaniaRussian FederationRwandaSamoaSao Tome and PrincipeSaudi ArabiaSenegalSerbiaSeychellesSierra LeoneSingaporeSint Maarten (Dutch part)Slovak RepublicSloveniaSmall statesSolomon IslandsSouth AfricaSouth AsiaSouth Asia (IDA & IBRD)South SudanSpainSri LankaSt. Kitts and NevisSt. LuciaSt. Vincent and the GrenadinesSub-Saharan Africa Sub-Saharan Africa (excluding high income)Sub-Saharan Africa (IDA & IBRD countries)SudanSurinameSwazilandSwedenSwitzerlandSyrian Arab RepublicTajikistanTanzaniaThailandTimor-LesteTogoTongaTrinidad and TobagoTunisiaTurkeyTuvaluUgandaUkraineUnited KingdomUnited StatesUpper middle incomeUruguayVanuatuVenezuela, RBVietnamWest Bank and GazaWorldYemen, Rep.ZambiaZimbabwe Timeline:
This timeline shows a graph from 1978 to 2014 of Libya. No data until 1977. Number of actual observations by date: 37.
Source name:
World Development Indicators
Source organization:
International Monetary Fund, Balance of Payments Statistics Yearbook and data files.
Categories, topics:
Economy & Growth
Last updated:
apr 23, 2017
Indicators value changes by year
Minimum:
243.877 mln
jan 1, 1978
Maximum:
4.517 bln
jan 1, 2008
At the date of observation
Value
Absolute change
Change from previous value
jan 1, 1978
243.877 mln
+243.877 mln
0.0%
jan 1, 1979
317.175 mln
+73.298 mln
30.06%
jan 1, 1980
423.576 mln
+106.401 mln
33.55%
jan 1, 1981
1.282 bln
+858.299 mln
202.63%
jan 1, 1982
1.627 bln
+344.868 mln
26.9%
jan 1, 1983
867.75 mln
-758.993 mln
-46.66%
jan 1, 1984
676.23 mln
-191.52 mln
-22.07%
jan 1, 1985
550.239 mln
-125.991 mln
-18.63%
jan 1, 1986
463.093 mln
-87.147 mln
-15.84%
jan 1, 1987
546.298 mln
+83.205 mln
17.97%
jan 1, 1988
725.183 mln
+178.885 mln
32.74%
jan 1, 1989
762.162 mln
+36.979 mln
5.1%
jan 1, 1990
447.261 mln
-314.901 mln
-41.32%
jan 1, 1991
666.367 mln
+219.107 mln
48.99%
jan 1, 1992
650.807 mln
-15.56 mln
-2.34%
jan 1, 1993
775.697 mln
+124.89 mln
19.19%
jan 1, 1994
570.687 mln
-205.01 mln
-26.43%
jan 1, 1995
448.376 mln
-122.31 mln
-21.43%
jan 1, 1996
435.495 mln
-12.881 mln
-2.87%
jan 1, 1997
474.359 mln
+38.864 mln
8.92%
jan 1, 1998
529.872 mln
+55.513 mln
11.7%
jan 1, 1999
532.749 mln
+2.878 mln
0.54%
jan 1, 2000
545.912 mln
+13.163 mln
2.47%
jan 1, 2001
723.0 mln
+177.088 mln
32.44%
jan 1, 2002
684.0 mln
-39.0 mln
-5.39%
jan 1, 2003
1.773 bln
+1.089 bln
159.21%
jan 1, 2004
1.689 bln
-84.0 mln
-4.74%
jan 1, 2005
1.339 bln
-350.0 mln
-20.72%
jan 1, 2006
1.837 bln
+498.0 mln
37.19%
jan 1, 2007
2.18 bln
+343.0 mln
18.67%
jan 1, 2008
4.517 bln
+2.337 bln
107.2%
jan 1, 2009
4.471 bln
-45.9 mln
-1.02%
jan 1, 2010
2.461 bln
-2.01 bln
-44.96%
jan 1, 2011
2.318 bln
-142.9 mln
-5.81%
jan 1, 2012
1.21 bln
-1.108 bln
-47.82%
jan 1, 2013
2.392 bln
+1.182 bln
97.74%
jan 1, 2014
2.275 bln
-116.6 mln
-4.87%
Ranking of countries by current statistics by years


Comments: