29
/
en
AIzaSyAYiBZKx7MnpbEhh9jyipgxe19OcubqV5w
April 1, 2024
119315
Denmark
DNK
true
2
1
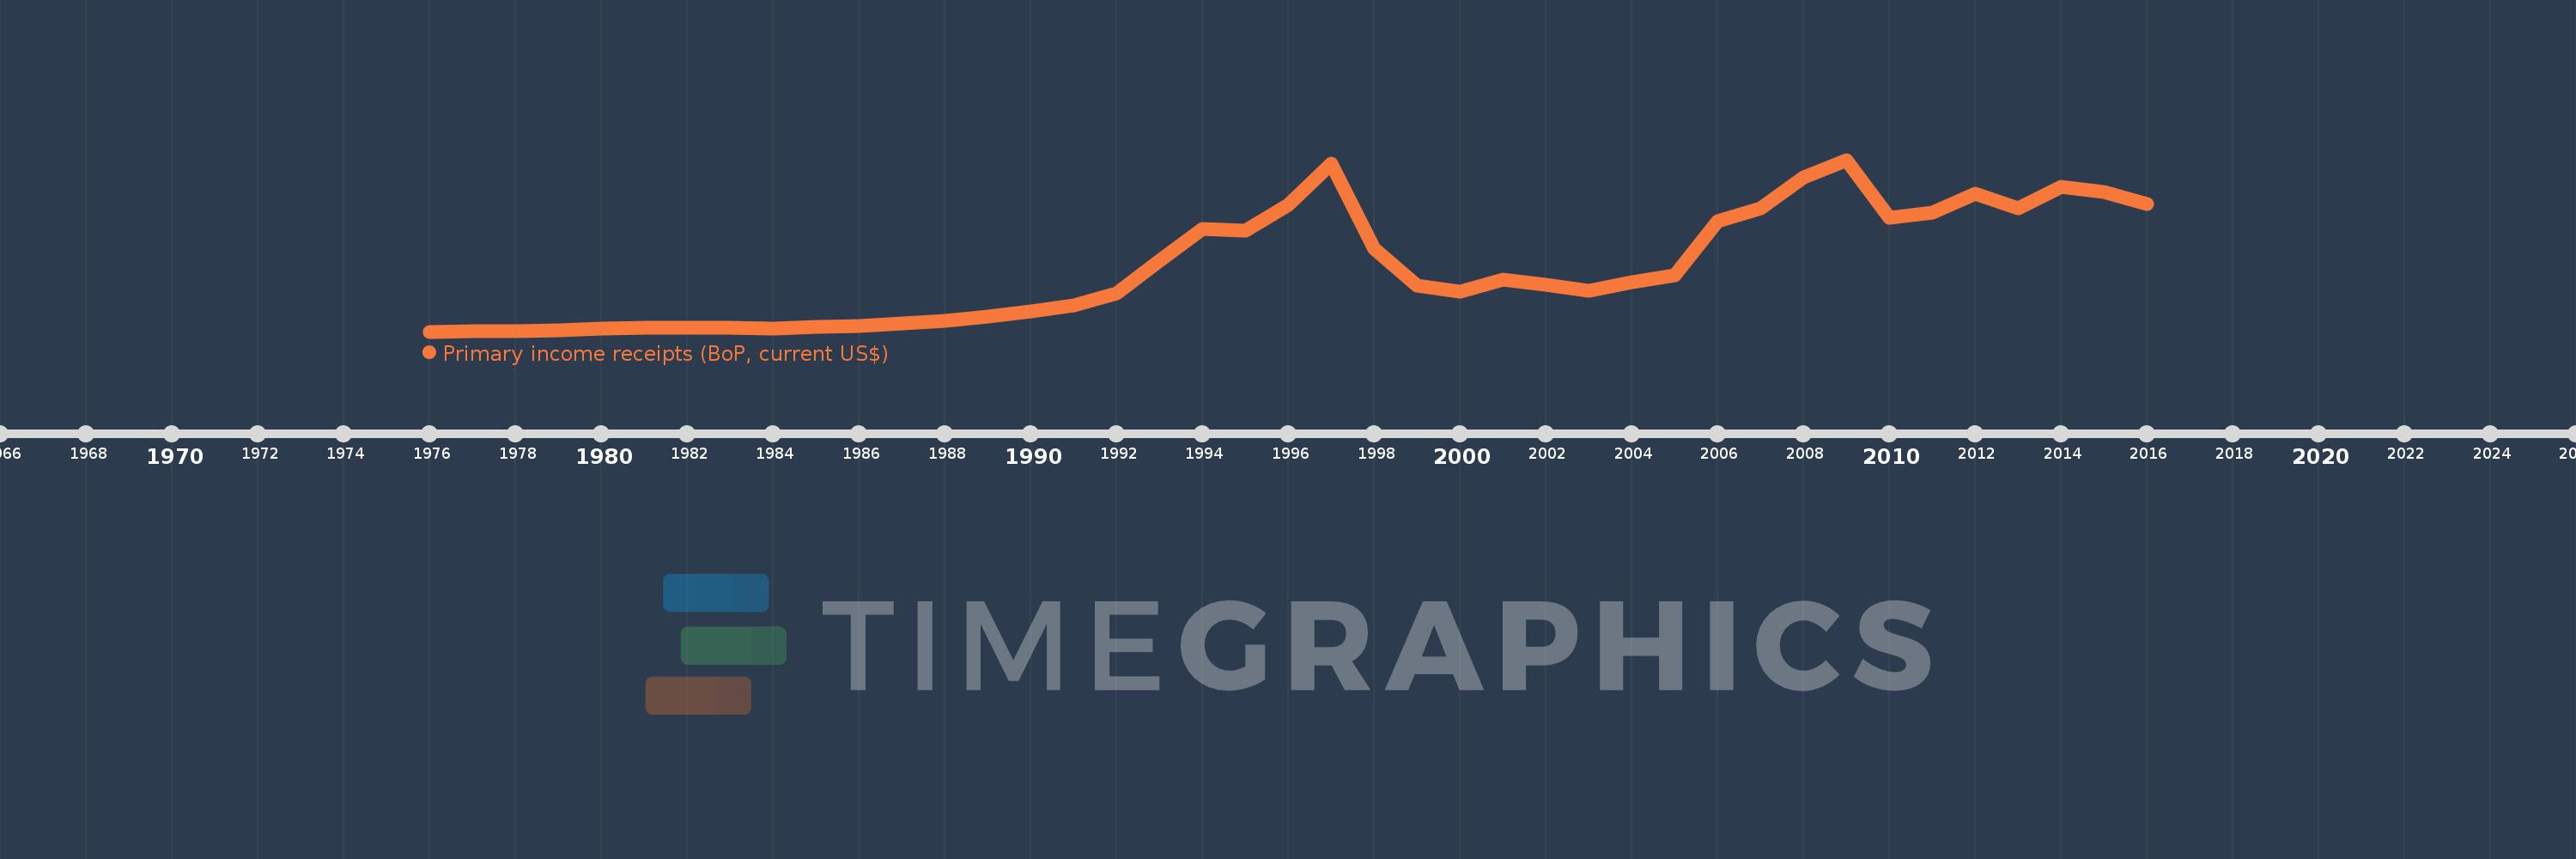
Primary income receipts (BoP, current US$)
2016,2015,2014,2013,2012,2011,2010,2009,2008,2007,2006,2005,2004,2003,2002,2001,2000,1999,1998,1997,1996,1995,1994,1993,1992,1991,1990,1989,1988,1987,1986,1985,1984,1983,1982,1981,1980,1979,1978,1977,1976
This statistics in other country:
AfghanistanAlbaniaAlgeriaAngolaAntigua and BarbudaArab WorldArgentinaArmeniaArubaAustraliaAustriaAzerbaijanBahamas, TheBahrainBangladeshBarbadosBelarusBelgiumBelizeBeninBermudaBhutanBoliviaBosnia and HerzegovinaBotswanaBrazilBrunei DarussalamBulgariaBurkina FasoBurundiCabo VerdeCambodiaCameroonCanadaCaribbean small statesCentral African RepublicCentral Europe and the BalticsChadChileChinaColombiaComorosCongo, Dem. Rep.Congo, Rep.Costa RicaCote d'IvoireCroatiaCuracaoCyprusCzech RepublicDenmarkDjiboutiDominicaDominican RepublicEarly-demographic dividendEast Asia & PacificEast Asia & Pacific (excluding high income)East Asia & Pacific (IDA & IBRD countries)EcuadorEgypt, Arab Rep.El SalvadorEquatorial GuineaEritreaEstoniaEthiopiaEuro areaEurope & Central AsiaEurope & Central Asia (excluding high income)Europe & Central Asia (IDA & IBRD countries)European UnionFaroe IslandsFijiFinlandFragile and conflict affected situationsFranceFrench PolynesiaGabonGambia, TheGeorgiaGermanyGhanaGreeceGrenadaGuatemalaGuineaGuinea-BissauGuyanaHaitiHeavily indebted poor countries (HIPC)High incomeHondurasHong Kong SAR, ChinaHungaryIBRD onlyIcelandIDA & IBRD totalIDA blendIDA onlyIDA totalIndiaIndonesiaIran, Islamic Rep.IraqIrelandIsraelItalyJamaicaJapanJordanKazakhstanKenyaKiribatiKorea, Rep.KosovoKuwaitKyrgyz RepublicLao PDRLate-demographic dividendLatin America & Caribbean Latin America & Caribbean (excluding high income)Latin America & the Caribbean (IDA & IBRD countries)LatviaLeast developed countries: UN classificationLebanonLesothoLiberiaLibyaLithuaniaLow & middle incomeLow incomeLower middle incomeLuxembourgMacao SAR, ChinaMacedonia, FYRMadagascarMalawiMalaysiaMaldivesMaliMaltaMarshall IslandsMauritaniaMauritiusMexicoMicronesia, Fed. Sts.Middle East & North AfricaMiddle East & North Africa (excluding high income)Middle East & North Africa (IDA & IBRD countries)Middle incomeMoldovaMongoliaMontenegroMoroccoMozambiqueMyanmarNamibiaNepalNetherlandsNew CaledoniaNew ZealandNicaraguaNigerNigeriaNorth AmericaNorwayOECD membersOmanOther small statesPacific island small statesPakistanPalauPanamaPapua New GuineaParaguayPeruPhilippinesPolandPortugalPost-demographic dividendPre-demographic dividendQatarRomaniaRussian FederationRwandaSamoaSao Tome and PrincipeSaudi ArabiaSenegalSerbiaSeychellesSierra LeoneSingaporeSint Maarten (Dutch part)Slovak RepublicSloveniaSmall statesSolomon IslandsSouth AfricaSouth AsiaSouth Asia (IDA & IBRD)South SudanSpainSri LankaSt. Kitts and NevisSt. LuciaSt. Vincent and the GrenadinesSub-Saharan Africa Sub-Saharan Africa (excluding high income)Sub-Saharan Africa (IDA & IBRD countries)SudanSurinameSwazilandSwedenSwitzerlandSyrian Arab RepublicTajikistanTanzaniaThailandTimor-LesteTogoTongaTrinidad and TobagoTunisiaTurkeyTuvaluUgandaUkraineUnited KingdomUnited StatesUpper middle incomeUruguayVanuatuVenezuela, RBVietnamWest Bank and GazaWorldYemen, Rep.ZambiaZimbabwe Timeline:
This timeline shows a graph from 1976 to 2016 of Denmark. No data until 1975. Number of actual observations by date: 41.
Source name:
World Development Indicators
Source organization:
International Monetary Fund, Balance of Payments Statistics Yearbook and data files.
Categories, topics:
Economy & Growth
Last updated:
apr 23, 2017
Indicators value changes by year
Minimum:
248.884 mln
jan 1, 1976
Maximum:
38.523 bln
jan 1, 2009
At the date of observation
Value
Absolute change
Change from previous value
jan 1, 1976
248.884 mln
+248.884 mln
0.0%
jan 1, 1977
255.237 mln
+6.353 mln
2.55%
jan 1, 1978
362.77 mln
+107.533 mln
42.13%
jan 1, 1979
542.636 mln
+179.865 mln
49.58%
jan 1, 1980
893.387 mln
+350.751 mln
64.64%
jan 1, 1981
1.127 bln
+233.582 mln
26.15%
jan 1, 1982
1.187 bln
+60.441 mln
5.36%
jan 1, 1983
1.146 bln
-41.707 mln
-3.51%
jan 1, 1984
909.101 mln
-236.602 mln
-20.65%
jan 1, 1985
1.227 bln
+318.254 mln
35.01%
jan 1, 1986
1.409 bln
+181.285 mln
14.77%
jan 1, 1987
1.995 bln
+586.161 mln
41.61%
jan 1, 1988
2.627 bln
+631.75 mln
31.67%
jan 1, 1989
3.677 bln
+1.05 bln
39.99%
jan 1, 1990
4.718 bln
+1.041 bln
28.32%
jan 1, 1991
6.011 bln
+1.293 bln
27.41%
jan 1, 1992
8.855 bln
+2.844 bln
47.31%
jan 1, 1993
15.956 bln
+7.101 bln
80.19%
jan 1, 1994
23.091 bln
+7.135 bln
44.72%
jan 1, 1995
22.743 bln
-347.575 mln
-1.51%
jan 1, 1996
28.433 bln
+5.69 bln
25.02%
jan 1, 1997
37.626 bln
+9.194 bln
32.33%
jan 1, 1998
18.774 bln
-18.852 bln
-50.1%
jan 1, 1999
10.401 bln
-8.373 bln
-44.6%
jan 1, 2000
9.09 bln
-1.311 bln
-12.61%
jan 1, 2001
11.883 bln
+2.793 bln
30.73%
jan 1, 2002
10.737 bln
-1.146 bln
-9.65%
jan 1, 2003
9.265 bln
-1.472 bln
-13.71%
jan 1, 2004
11.18 bln
+1.915 bln
20.66%
jan 1, 2005
12.784 bln
+1.604 bln
14.35%
jan 1, 2006
24.929 bln
+12.145 bln
95.0%
jan 1, 2007
27.764 bln
+2.835 bln
11.37%
jan 1, 2008
34.683 bln
+6.919 bln
24.92%
jan 1, 2009
38.523 bln
+3.84 bln
11.07%
jan 1, 2010
25.573 bln
-12.949 bln
-33.61%
jan 1, 2011
26.782 bln
+1.208 bln
4.72%
jan 1, 2012
30.919 bln
+4.137 bln
15.45%
jan 1, 2013
27.722 bln
-3.196 bln
-10.34%
jan 1, 2014
32.464 bln
+4.742 bln
17.1%
jan 1, 2015
31.299 bln
-1.165 bln
-3.59%
jan 1, 2016
28.599 bln
-2.7 bln
-8.63%
Ranking of countries by current statistics by years


Comments: