29
/
en
AIzaSyAYiBZKx7MnpbEhh9jyipgxe19OcubqV5w
April 1, 2024
165457
Jordan
JOR
true
2
1
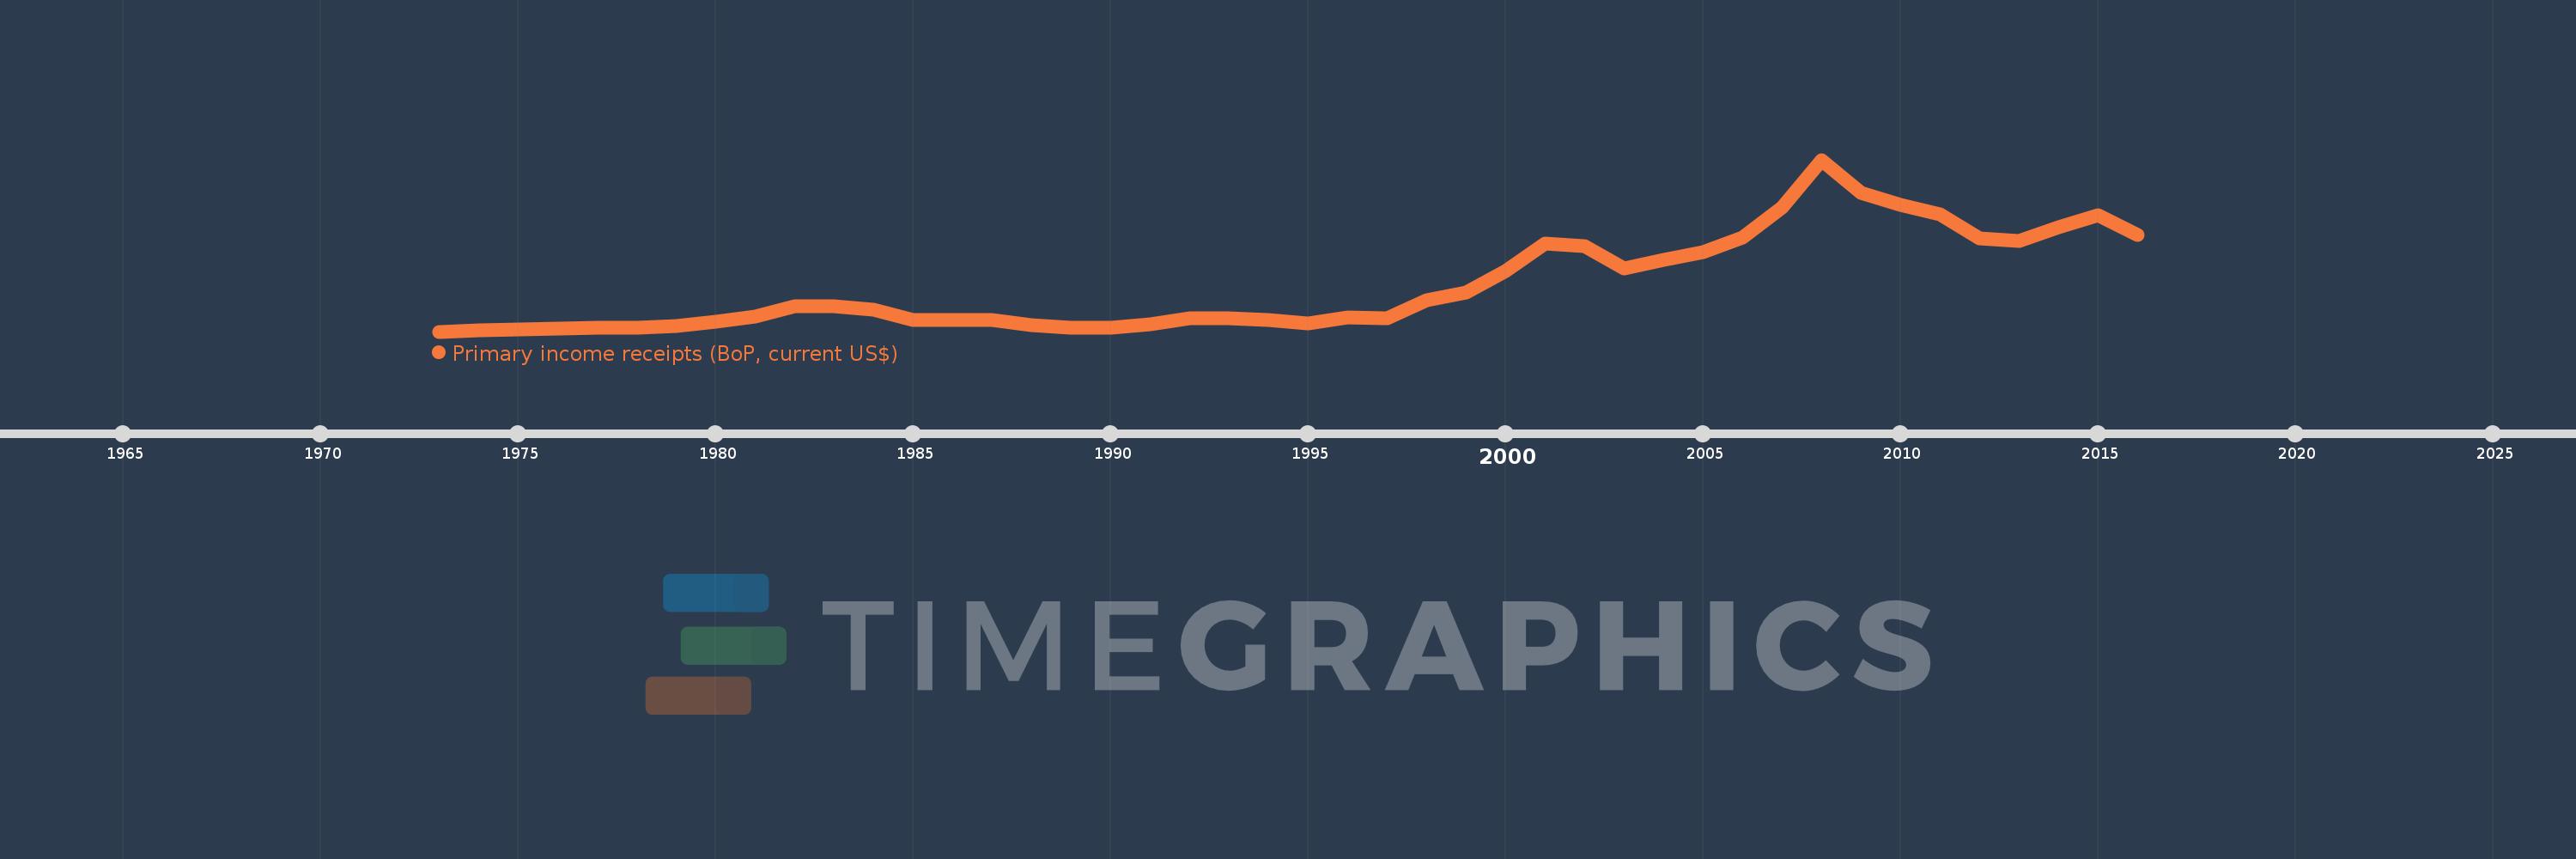
Primary income receipts (BoP, current US$)
2016,2015,2014,2013,2012,2011,2010,2009,2008,2007,2006,2005,2004,2003,2002,2001,2000,1999,1998,1997,1996,1995,1994,1993,1992,1991,1990,1989,1988,1987,1986,1985,1984,1983,1982,1981,1980,1979,1978,1977,1976,1975,1974,1973
This statistics in other country:
AfghanistanAlbaniaAlgeriaAngolaAntigua and BarbudaArab WorldArgentinaArmeniaArubaAustraliaAustriaAzerbaijanBahamas, TheBahrainBangladeshBarbadosBelarusBelgiumBelizeBeninBermudaBhutanBoliviaBosnia and HerzegovinaBotswanaBrazilBrunei DarussalamBulgariaBurkina FasoBurundiCabo VerdeCambodiaCameroonCanadaCaribbean small statesCentral African RepublicCentral Europe and the BalticsChadChileChinaColombiaComorosCongo, Dem. Rep.Congo, Rep.Costa RicaCote d'IvoireCroatiaCuracaoCyprusCzech RepublicDenmarkDjiboutiDominicaDominican RepublicEarly-demographic dividendEast Asia & PacificEast Asia & Pacific (excluding high income)East Asia & Pacific (IDA & IBRD countries)EcuadorEgypt, Arab Rep.El SalvadorEquatorial GuineaEritreaEstoniaEthiopiaEuro areaEurope & Central AsiaEurope & Central Asia (excluding high income)Europe & Central Asia (IDA & IBRD countries)European UnionFaroe IslandsFijiFinlandFragile and conflict affected situationsFranceFrench PolynesiaGabonGambia, TheGeorgiaGermanyGhanaGreeceGrenadaGuatemalaGuineaGuinea-BissauGuyanaHaitiHeavily indebted poor countries (HIPC)High incomeHondurasHong Kong SAR, ChinaHungaryIBRD onlyIcelandIDA & IBRD totalIDA blendIDA onlyIDA totalIndiaIndonesiaIran, Islamic Rep.IraqIrelandIsraelItalyJamaicaJapanJordanKazakhstanKenyaKiribatiKorea, Rep.KosovoKuwaitKyrgyz RepublicLao PDRLate-demographic dividendLatin America & Caribbean Latin America & Caribbean (excluding high income)Latin America & the Caribbean (IDA & IBRD countries)LatviaLeast developed countries: UN classificationLebanonLesothoLiberiaLibyaLithuaniaLow & middle incomeLow incomeLower middle incomeLuxembourgMacao SAR, ChinaMacedonia, FYRMadagascarMalawiMalaysiaMaldivesMaliMaltaMarshall IslandsMauritaniaMauritiusMexicoMicronesia, Fed. Sts.Middle East & North AfricaMiddle East & North Africa (excluding high income)Middle East & North Africa (IDA & IBRD countries)Middle incomeMoldovaMongoliaMontenegroMoroccoMozambiqueMyanmarNamibiaNepalNetherlandsNew CaledoniaNew ZealandNicaraguaNigerNigeriaNorth AmericaNorwayOECD membersOmanOther small statesPacific island small statesPakistanPalauPanamaPapua New GuineaParaguayPeruPhilippinesPolandPortugalPost-demographic dividendPre-demographic dividendQatarRomaniaRussian FederationRwandaSamoaSao Tome and PrincipeSaudi ArabiaSenegalSerbiaSeychellesSierra LeoneSingaporeSint Maarten (Dutch part)Slovak RepublicSloveniaSmall statesSolomon IslandsSouth AfricaSouth AsiaSouth Asia (IDA & IBRD)South SudanSpainSri LankaSt. Kitts and NevisSt. LuciaSt. Vincent and the GrenadinesSub-Saharan Africa Sub-Saharan Africa (excluding high income)Sub-Saharan Africa (IDA & IBRD countries)SudanSurinameSwazilandSwedenSwitzerlandSyrian Arab RepublicTajikistanTanzaniaThailandTimor-LesteTogoTongaTrinidad and TobagoTunisiaTurkeyTuvaluUgandaUkraineUnited KingdomUnited StatesUpper middle incomeUruguayVanuatuVenezuela, RBVietnamWest Bank and GazaWorldYemen, Rep.ZambiaZimbabwe Timeline:
This timeline shows a graph from 1973 to 2016 of Jordan. No data until 1972. Number of actual observations by date: 44.
Source name:
World Development Indicators
Source organization:
International Monetary Fund, Balance of Payments Statistics Yearbook and data files.
Categories, topics:
Economy & Growth
Last updated:
apr 23, 2017
Indicators value changes by year
Minimum:
12.32 mln
jan 1, 1973
Maximum:
1.296 bln
jan 1, 2008
At the date of observation
Value
Absolute change
Change from previous value
jan 1, 1973
12.32 mln
+12.32 mln
0.0%
jan 1, 1974
19.174 mln
+6.854 mln
55.63%
jan 1, 1975
27.321 mln
+8.147 mln
42.49%
jan 1, 1976
35.336 mln
+8.014 mln
29.33%
jan 1, 1977
39.159 mln
+3.823 mln
10.82%
jan 1, 1978
40.415 mln
+1.257 mln
3.21%
jan 1, 1979
51.454 mln
+11.038 mln
27.31%
jan 1, 1980
88.074 mln
+36.621 mln
71.17%
jan 1, 1981
126.095 mln
+38.021 mln
43.17%
jan 1, 1982
200.356 mln
+74.26 mln
58.89%
jan 1, 1983
204.707 mln
+4.352 mln
2.17%
jan 1, 1984
173.005 mln
-31.702 mln
-15.49%
jan 1, 1985
100.745 mln
-72.261 mln
-41.77%
jan 1, 1986
101.067 mln
+322.763K
0.32%
jan 1, 1987
100.092 mln
-975.141K
-0.96%
jan 1, 1988
58.324 mln
-41.769 mln
-41.73%
jan 1, 1989
40.647 mln
-17.677 mln
-30.31%
jan 1, 1990
38.96 mln
-1.687 mln
-4.15%
jan 1, 1991
67.285 mln
+28.326 mln
72.71%
jan 1, 1992
114.267 mln
+46.982 mln
69.82%
jan 1, 1993
112.423 mln
-1.844 mln
-1.61%
jan 1, 1994
98.966 mln
-13.457 mln
-11.97%
jan 1, 1995
72.709 mln
-26.257 mln
-26.53%
jan 1, 1996
115.733 mln
+43.024 mln
59.17%
jan 1, 1997
111.707 mln
-4.027 mln
-3.48%
jan 1, 1998
248.237 mln
+136.53 mln
122.22%
jan 1, 1999
306.911 mln
+58.674 mln
23.64%
jan 1, 2000
467.56 mln
+160.649 mln
52.34%
jan 1, 2001
668.011 mln
+200.451 mln
42.87%
jan 1, 2002
652.493 mln
-15.519 mln
-2.32%
jan 1, 2003
483.498 mln
-168.995 mln
-25.9%
jan 1, 2004
550.488 mln
+66.99 mln
13.86%
jan 1, 2005
606.384 mln
+55.896 mln
10.15%
jan 1, 2006
712.475 mln
+106.092 mln
17.5%
jan 1, 2007
942.567 mln
+230.092 mln
32.29%
jan 1, 2008
1.296 bln
+353.512 mln
37.51%
jan 1, 2009
1.052 bln
-244.384 mln
-18.86%
jan 1, 2010
961.127 mln
-90.569 mln
-8.61%
jan 1, 2011
887.225 mln
-73.901 mln
-7.69%
jan 1, 2012
710.394 mln
-176.831 mln
-19.93%
jan 1, 2013
690.141 mln
-20.254 mln
-2.85%
jan 1, 2014
793.507 mln
+103.366 mln
14.98%
jan 1, 2015
880.099 mln
+86.592 mln
10.91%
jan 1, 2016
736.0 mln
-144.099 mln
-16.37%
Ranking of countries by current statistics by years


Comments: