29
/
en
AIzaSyAYiBZKx7MnpbEhh9jyipgxe19OcubqV5w
April 1, 2024
117342
Cyprus
CYP
true
2
1
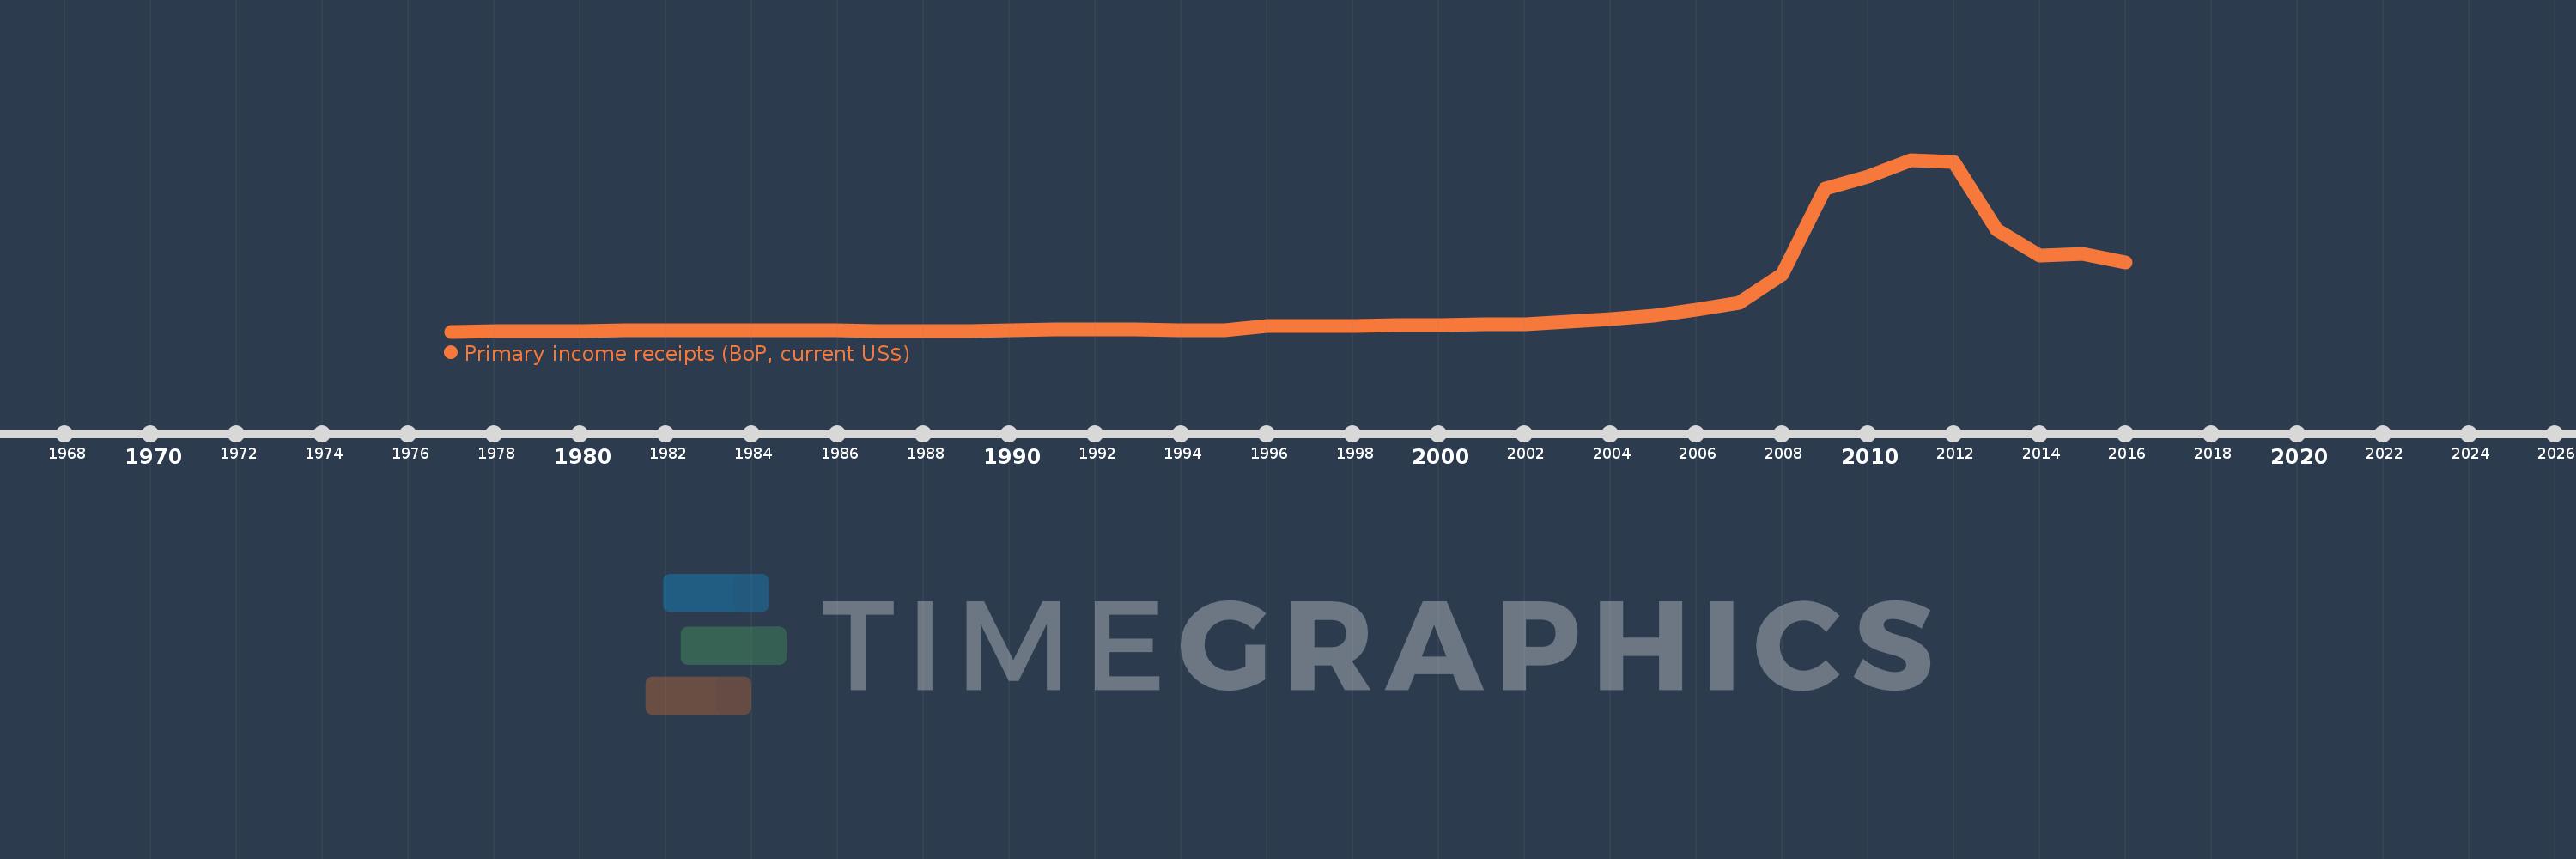
Primary income receipts (BoP, current US$)
2016,2015,2014,2013,2012,2011,2010,2009,2008,2007,2006,2005,2004,2003,2002,2001,2000,1999,1998,1997,1996,1995,1994,1993,1992,1991,1990,1989,1988,1987,1986,1985,1984,1983,1982,1981,1980,1979,1978,1977
This statistics in other country:
AfghanistanAlbaniaAlgeriaAngolaAntigua and BarbudaArab WorldArgentinaArmeniaArubaAustraliaAustriaAzerbaijanBahamas, TheBahrainBangladeshBarbadosBelarusBelgiumBelizeBeninBermudaBhutanBoliviaBosnia and HerzegovinaBotswanaBrazilBrunei DarussalamBulgariaBurkina FasoBurundiCabo VerdeCambodiaCameroonCanadaCaribbean small statesCentral African RepublicCentral Europe and the BalticsChadChileChinaColombiaComorosCongo, Dem. Rep.Congo, Rep.Costa RicaCote d'IvoireCroatiaCuracaoCyprusCzech RepublicDenmarkDjiboutiDominicaDominican RepublicEarly-demographic dividendEast Asia & PacificEast Asia & Pacific (excluding high income)East Asia & Pacific (IDA & IBRD countries)EcuadorEgypt, Arab Rep.El SalvadorEquatorial GuineaEritreaEstoniaEthiopiaEuro areaEurope & Central AsiaEurope & Central Asia (excluding high income)Europe & Central Asia (IDA & IBRD countries)European UnionFaroe IslandsFijiFinlandFragile and conflict affected situationsFranceFrench PolynesiaGabonGambia, TheGeorgiaGermanyGhanaGreeceGrenadaGuatemalaGuineaGuinea-BissauGuyanaHaitiHeavily indebted poor countries (HIPC)High incomeHondurasHong Kong SAR, ChinaHungaryIBRD onlyIcelandIDA & IBRD totalIDA blendIDA onlyIDA totalIndiaIndonesiaIran, Islamic Rep.IraqIrelandIsraelItalyJamaicaJapanJordanKazakhstanKenyaKiribatiKorea, Rep.KosovoKuwaitKyrgyz RepublicLao PDRLate-demographic dividendLatin America & Caribbean Latin America & Caribbean (excluding high income)Latin America & the Caribbean (IDA & IBRD countries)LatviaLeast developed countries: UN classificationLebanonLesothoLiberiaLibyaLithuaniaLow & middle incomeLow incomeLower middle incomeLuxembourgMacao SAR, ChinaMacedonia, FYRMadagascarMalawiMalaysiaMaldivesMaliMaltaMarshall IslandsMauritaniaMauritiusMexicoMicronesia, Fed. Sts.Middle East & North AfricaMiddle East & North Africa (excluding high income)Middle East & North Africa (IDA & IBRD countries)Middle incomeMoldovaMongoliaMontenegroMoroccoMozambiqueMyanmarNamibiaNepalNetherlandsNew CaledoniaNew ZealandNicaraguaNigerNigeriaNorth AmericaNorwayOECD membersOmanOther small statesPacific island small statesPakistanPalauPanamaPapua New GuineaParaguayPeruPhilippinesPolandPortugalPost-demographic dividendPre-demographic dividendQatarRomaniaRussian FederationRwandaSamoaSao Tome and PrincipeSaudi ArabiaSenegalSerbiaSeychellesSierra LeoneSingaporeSint Maarten (Dutch part)Slovak RepublicSloveniaSmall statesSolomon IslandsSouth AfricaSouth AsiaSouth Asia (IDA & IBRD)South SudanSpainSri LankaSt. Kitts and NevisSt. LuciaSt. Vincent and the GrenadinesSub-Saharan Africa Sub-Saharan Africa (excluding high income)Sub-Saharan Africa (IDA & IBRD countries)SudanSurinameSwazilandSwedenSwitzerlandSyrian Arab RepublicTajikistanTanzaniaThailandTimor-LesteTogoTongaTrinidad and TobagoTunisiaTurkeyTuvaluUgandaUkraineUnited KingdomUnited StatesUpper middle incomeUruguayVanuatuVenezuela, RBVietnamWest Bank and GazaWorldYemen, Rep.ZambiaZimbabwe Timeline:
This timeline shows a graph from 1977 to 2016 of Cyprus. No data until 1976. Number of actual observations by date: 40.
Source name:
World Development Indicators
Source organization:
International Monetary Fund, Balance of Payments Statistics Yearbook and data files.
Categories, topics:
Economy & Growth
Last updated:
apr 23, 2017
Indicators value changes by year
Minimum:
29.477 mln
jan 1, 1977
Maximum:
12.498 bln
jan 1, 2011
At the date of observation
Value
Absolute change
Change from previous value
jan 1, 1977
29.477 mln
+29.477 mln
0.0%
jan 1, 1978
46.555 mln
+17.078 mln
57.94%
jan 1, 1979
60.774 mln
+14.22 mln
30.54%
jan 1, 1980
74.201 mln
+13.426 mln
22.09%
jan 1, 1981
97.719 mln
+23.519 mln
31.7%
jan 1, 1982
102.271 mln
+4.551 mln
4.66%
jan 1, 1983
115.275 mln
+13.004 mln
12.72%
jan 1, 1984
102.916 mln
-12.358 mln
-10.72%
jan 1, 1985
109.962 mln
+7.045 mln
6.85%
jan 1, 1986
115.582 mln
+5.62 mln
5.11%
jan 1, 1987
68.514 mln
-47.068 mln
-40.72%
jan 1, 1988
77.531 mln
+9.017 mln
13.16%
jan 1, 1989
87.864 mln
+10.333 mln
13.33%
jan 1, 1990
119.08 mln
+31.216 mln
35.53%
jan 1, 1991
158.924 mln
+39.844 mln
33.46%
jan 1, 1992
175.269 mln
+16.345 mln
10.28%
jan 1, 1993
156.824 mln
-18.445 mln
-10.52%
jan 1, 1994
131.884 mln
-24.94 mln
-15.9%
jan 1, 1995
121.498 mln
-10.387 mln
-7.88%
jan 1, 1996
443.835 mln
+322.338 mln
265.3%
jan 1, 1997
417.747 mln
-26.088 mln
-5.88%
jan 1, 1998
440.135 mln
+22.388 mln
5.36%
jan 1, 1999
470.241 mln
+30.106 mln
6.84%
jan 1, 2000
493.271 mln
+23.03 mln
4.9%
jan 1, 2001
572.409 mln
+79.138 mln
16.04%
jan 1, 2002
558.944 mln
-13.464 mln
-2.35%
jan 1, 2003
756.935 mln
+197.991 mln
35.42%
jan 1, 2004
905.489 mln
+148.554 mln
19.63%
jan 1, 2005
1.16 bln
+254.632 mln
28.12%
jan 1, 2006
1.635 bln
+474.656 mln
40.91%
jan 1, 2007
2.139 bln
+504.325 mln
30.85%
jan 1, 2008
4.163 bln
+2.024 bln
94.64%
jan 1, 2009
10.438 bln
+6.275 bln
150.71%
jan 1, 2010
11.285 bln
+847.364 mln
8.12%
jan 1, 2011
12.498 bln
+1.213 bln
10.75%
jan 1, 2012
12.369 bln
-129.2 mln
-1.03%
jan 1, 2013
7.413 bln
-4.956 bln
-40.07%
jan 1, 2014
5.536 bln
-1.877 bln
-25.32%
jan 1, 2015
5.687 bln
+150.805 mln
2.72%
jan 1, 2016
5.043 bln
-644.026 mln
-11.32%
Ranking of countries by current statistics by years


Comments: