29
/
en
AIzaSyAYiBZKx7MnpbEhh9jyipgxe19OcubqV5w
April 1, 2024
105382
Chile
CHL
true
2
1
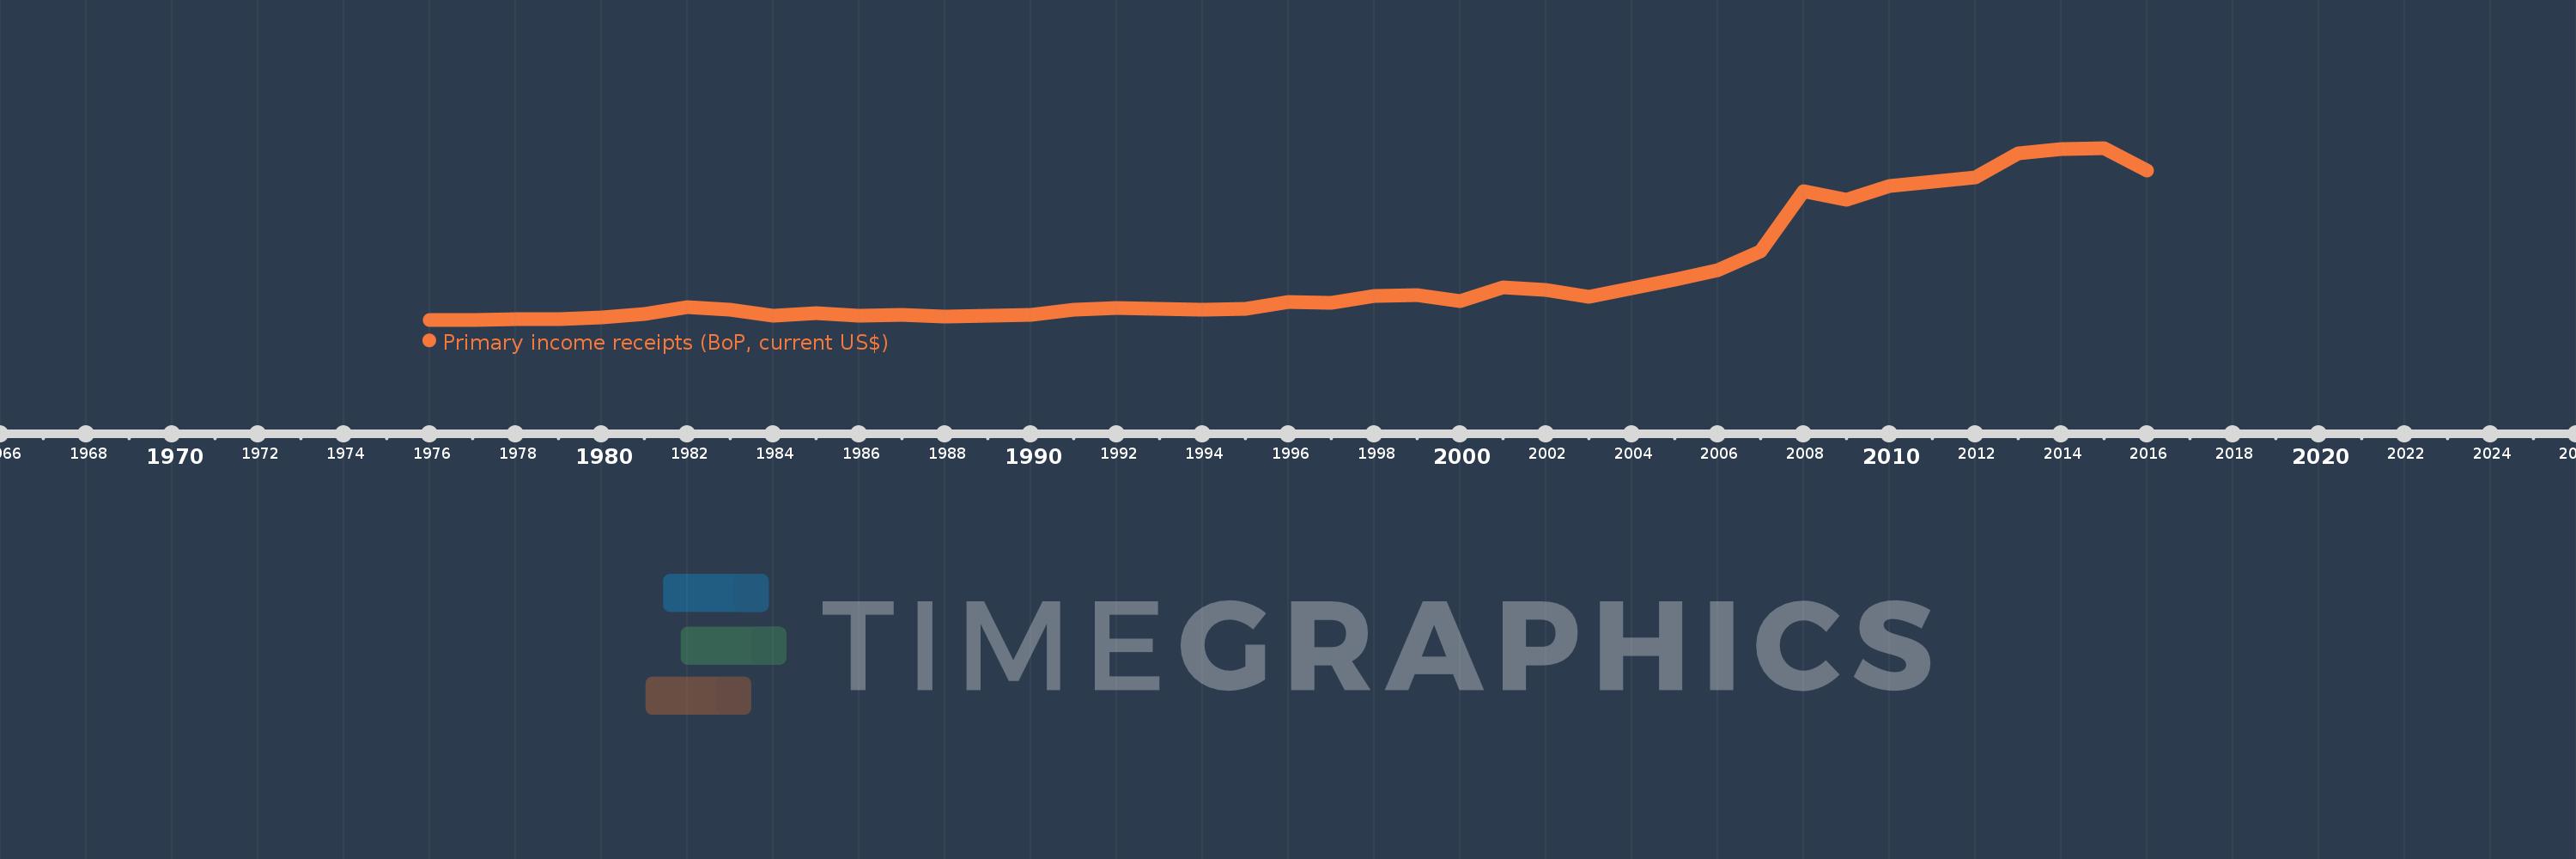
Primary income receipts (BoP, current US$)
2016,2015,2014,2013,2012,2011,2010,2009,2008,2007,2006,2005,2004,2003,2002,2001,2000,1999,1998,1997,1996,1995,1994,1993,1992,1991,1990,1989,1988,1987,1986,1985,1984,1983,1982,1981,1980,1979,1978,1977,1976
This statistics in other country:
AfghanistanAlbaniaAlgeriaAngolaAntigua and BarbudaArab WorldArgentinaArmeniaArubaAustraliaAustriaAzerbaijanBahamas, TheBahrainBangladeshBarbadosBelarusBelgiumBelizeBeninBermudaBhutanBoliviaBosnia and HerzegovinaBotswanaBrazilBrunei DarussalamBulgariaBurkina FasoBurundiCabo VerdeCambodiaCameroonCanadaCaribbean small statesCentral African RepublicCentral Europe and the BalticsChadChileChinaColombiaComorosCongo, Dem. Rep.Congo, Rep.Costa RicaCote d'IvoireCroatiaCuracaoCyprusCzech RepublicDenmarkDjiboutiDominicaDominican RepublicEarly-demographic dividendEast Asia & PacificEast Asia & Pacific (excluding high income)East Asia & Pacific (IDA & IBRD countries)EcuadorEgypt, Arab Rep.El SalvadorEquatorial GuineaEritreaEstoniaEthiopiaEuro areaEurope & Central AsiaEurope & Central Asia (excluding high income)Europe & Central Asia (IDA & IBRD countries)European UnionFaroe IslandsFijiFinlandFragile and conflict affected situationsFranceFrench PolynesiaGabonGambia, TheGeorgiaGermanyGhanaGreeceGrenadaGuatemalaGuineaGuinea-BissauGuyanaHaitiHeavily indebted poor countries (HIPC)High incomeHondurasHong Kong SAR, ChinaHungaryIBRD onlyIcelandIDA & IBRD totalIDA blendIDA onlyIDA totalIndiaIndonesiaIran, Islamic Rep.IraqIrelandIsraelItalyJamaicaJapanJordanKazakhstanKenyaKiribatiKorea, Rep.KosovoKuwaitKyrgyz RepublicLao PDRLate-demographic dividendLatin America & Caribbean Latin America & Caribbean (excluding high income)Latin America & the Caribbean (IDA & IBRD countries)LatviaLeast developed countries: UN classificationLebanonLesothoLiberiaLibyaLithuaniaLow & middle incomeLow incomeLower middle incomeLuxembourgMacao SAR, ChinaMacedonia, FYRMadagascarMalawiMalaysiaMaldivesMaliMaltaMarshall IslandsMauritaniaMauritiusMexicoMicronesia, Fed. Sts.Middle East & North AfricaMiddle East & North Africa (excluding high income)Middle East & North Africa (IDA & IBRD countries)Middle incomeMoldovaMongoliaMontenegroMoroccoMozambiqueMyanmarNamibiaNepalNetherlandsNew CaledoniaNew ZealandNicaraguaNigerNigeriaNorth AmericaNorwayOECD membersOmanOther small statesPacific island small statesPakistanPalauPanamaPapua New GuineaParaguayPeruPhilippinesPolandPortugalPost-demographic dividendPre-demographic dividendQatarRomaniaRussian FederationRwandaSamoaSao Tome and PrincipeSaudi ArabiaSenegalSerbiaSeychellesSierra LeoneSingaporeSint Maarten (Dutch part)Slovak RepublicSloveniaSmall statesSolomon IslandsSouth AfricaSouth AsiaSouth Asia (IDA & IBRD)South SudanSpainSri LankaSt. Kitts and NevisSt. LuciaSt. Vincent and the GrenadinesSub-Saharan Africa Sub-Saharan Africa (excluding high income)Sub-Saharan Africa (IDA & IBRD countries)SudanSurinameSwazilandSwedenSwitzerlandSyrian Arab RepublicTajikistanTanzaniaThailandTimor-LesteTogoTongaTrinidad and TobagoTunisiaTurkeyTuvaluUgandaUkraineUnited KingdomUnited StatesUpper middle incomeUruguayVanuatuVenezuela, RBVietnamWest Bank and GazaWorldYemen, Rep.ZambiaZimbabwe Timeline:
This timeline shows a graph from 1976 to 2016 of Chile. No data until 1975. Number of actual observations by date: 41.
Source name:
World Development Indicators
Source organization:
International Monetary Fund, Balance of Payments Statistics Yearbook and data files.
Categories, topics:
Economy & Growth
Last updated:
apr 23, 2017
Indicators value changes by year
Minimum:
4.0 mln
jan 1, 1976
Maximum:
8.459 bln
jan 1, 2015
At the date of observation
Value
Absolute change
Change from previous value
jan 1, 1976
4.0 mln
+4.0 mln
0.0%
jan 1, 1977
12.0 mln
+8.0 mln
200.0%
jan 1, 1978
18.0 mln
+6.0 mln
50.0%
jan 1, 1979
43.0 mln
+25.0 mln
138.89%
jan 1, 1980
126.0 mln
+83.0 mln
193.02%
jan 1, 1981
308.0 mln
+182.0 mln
144.44%
jan 1, 1982
606.0 mln
+298.0 mln
96.75%
jan 1, 1983
512.0 mln
-94.0 mln
-15.51%
jan 1, 1984
203.0 mln
-309.0 mln
-60.35%
jan 1, 1985
322.0 mln
+119.0 mln
58.62%
jan 1, 1986
200.8 mln
-121.2 mln
-37.64%
jan 1, 1987
228.4 mln
+27.6 mln
13.75%
jan 1, 1988
175.8 mln
-52.6 mln
-23.03%
jan 1, 1989
184.9 mln
+9.1 mln
5.18%
jan 1, 1990
242.8 mln
+57.9 mln
31.31%
jan 1, 1991
484.1 mln
+241.3 mln
99.38%
jan 1, 1992
576.2 mln
+92.1 mln
19.02%
jan 1, 1993
557.7 mln
-18.5 mln
-3.21%
jan 1, 1994
501.8 mln
-55.9 mln
-10.02%
jan 1, 1995
556.4 mln
+54.6 mln
10.88%
jan 1, 1996
868.5 mln
+312.1 mln
56.09%
jan 1, 1997
841.7 mln
-26.8 mln
-3.09%
jan 1, 1998
1.17 bln
+328.2 mln
38.99%
jan 1, 1999
1.196 bln
+26.2 mln
2.24%
jan 1, 2000
912.283 mln
-283.817 mln
-23.73%
jan 1, 2001
1.598 bln
+685.353 mln
75.13%
jan 1, 2002
1.458 bln
-139.341 mln
-8.72%
jan 1, 2003
1.114 bln
-344.602 mln
-23.63%
jan 1, 2004
1.552 bln
+438.678 mln
39.39%
jan 1, 2005
1.983 bln
+430.743 mln
27.75%
jan 1, 2006
2.452 bln
+468.993 mln
23.65%
jan 1, 2007
3.374 bln
+922.263 mln
37.61%
jan 1, 2008
6.325 bln
+2.951 bln
87.44%
jan 1, 2009
5.928 bln
-396.874 mln
-6.27%
jan 1, 2010
6.571 bln
+642.709 mln
10.84%
jan 1, 2011
6.797 bln
+226.281 mln
3.44%
jan 1, 2012
7.007 bln
+209.988 mln
3.09%
jan 1, 2013
8.18 bln
+1.173 bln
16.74%
jan 1, 2014
8.421 bln
+241.394 mln
2.95%
jan 1, 2015
8.459 bln
+37.416 mln
0.44%
jan 1, 2016
7.361 bln
-1.098 bln
-12.98%
Ranking of countries by current statistics by years


Comments: