29
/
en
AIzaSyAYiBZKx7MnpbEhh9jyipgxe19OcubqV5w
April 1, 2024
174712
Lao PDR
LAO
true
2
1
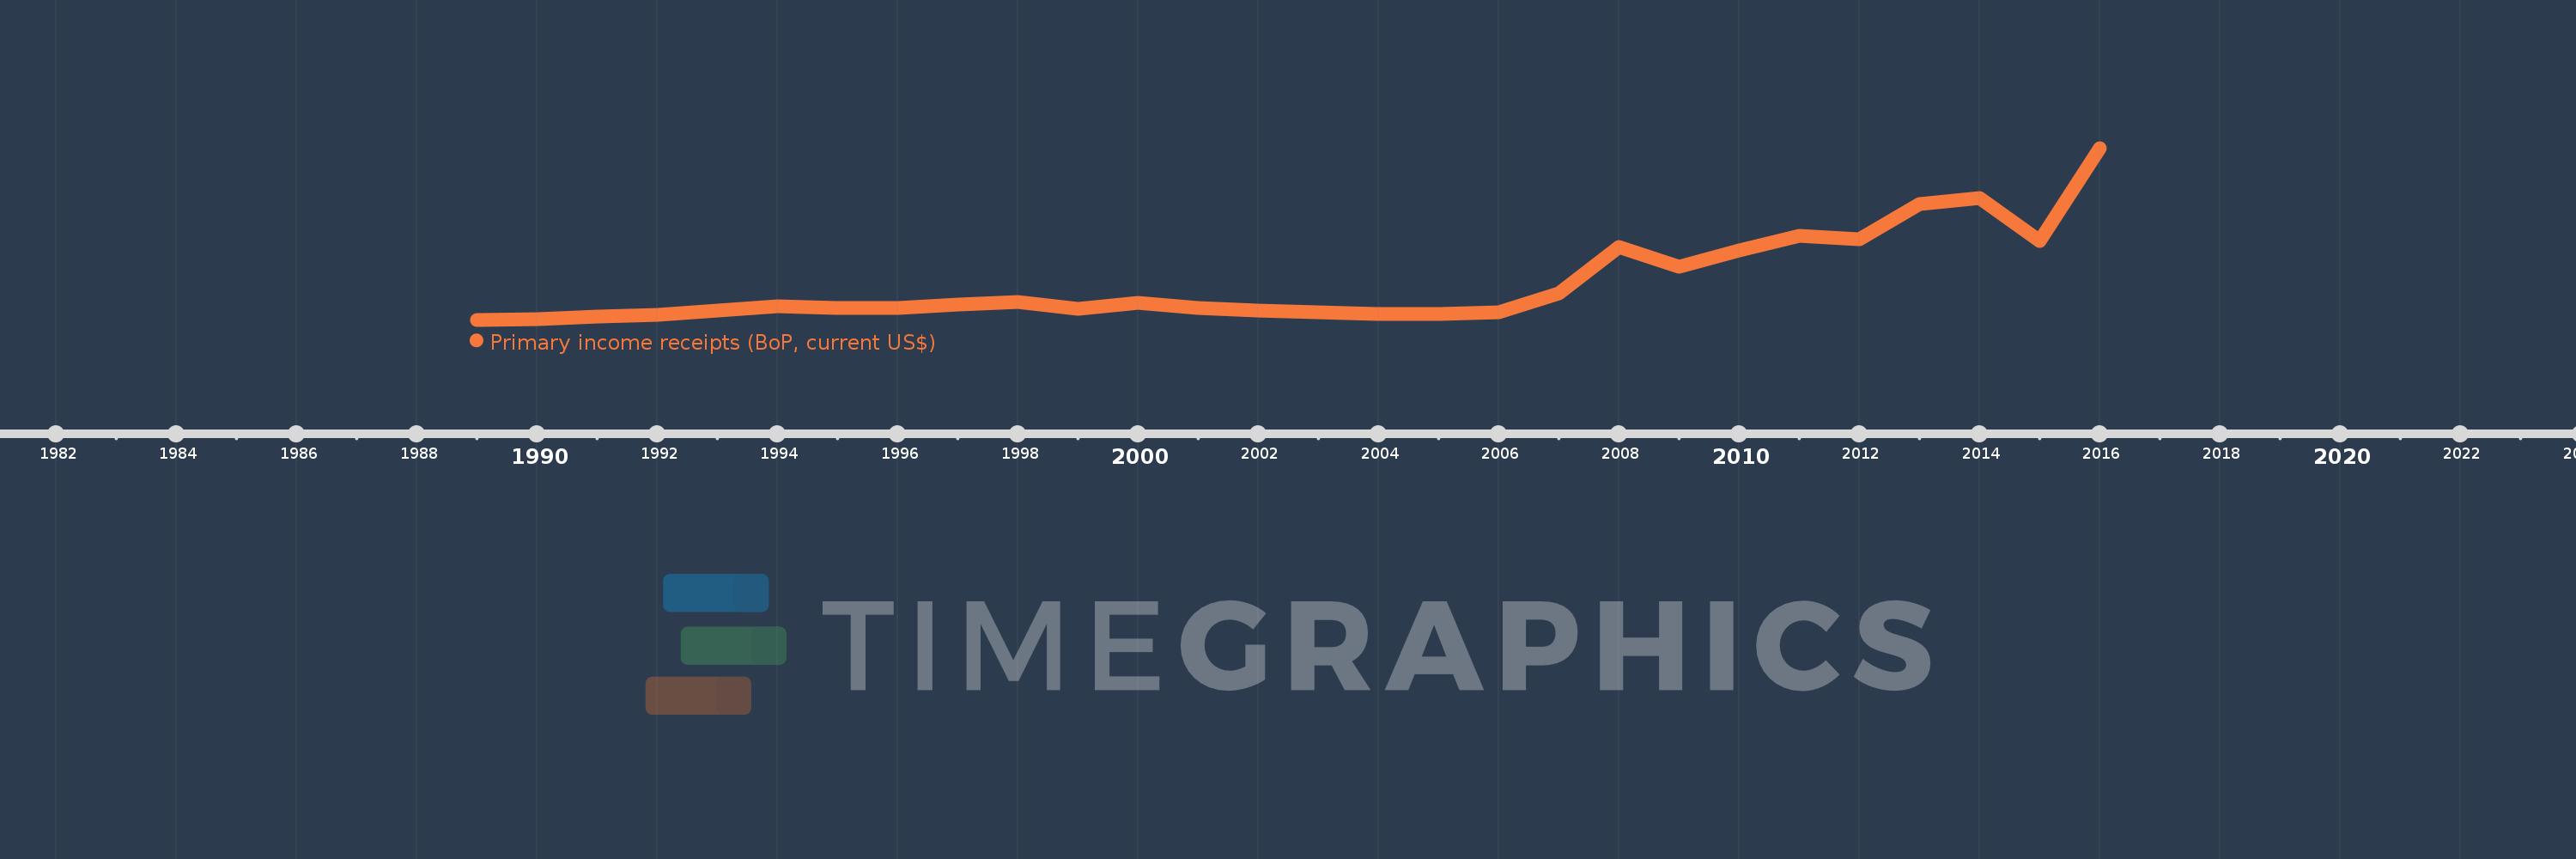
Primary income receipts (BoP, current US$)
2016,2015,2014,2013,2012,2011,2010,2009,2008,2007,2006,2005,2004,2003,2002,2001,2000,1999,1998,1997,1996,1995,1994,1993,1992,1991,1990,1989
This statistics in other country:
AfghanistanAlbaniaAlgeriaAngolaAntigua and BarbudaArab WorldArgentinaArmeniaArubaAustraliaAustriaAzerbaijanBahamas, TheBahrainBangladeshBarbadosBelarusBelgiumBelizeBeninBermudaBhutanBoliviaBosnia and HerzegovinaBotswanaBrazilBrunei DarussalamBulgariaBurkina FasoBurundiCabo VerdeCambodiaCameroonCanadaCaribbean small statesCentral African RepublicCentral Europe and the BalticsChadChileChinaColombiaComorosCongo, Dem. Rep.Congo, Rep.Costa RicaCote d'IvoireCroatiaCuracaoCyprusCzech RepublicDenmarkDjiboutiDominicaDominican RepublicEarly-demographic dividendEast Asia & PacificEast Asia & Pacific (excluding high income)East Asia & Pacific (IDA & IBRD countries)EcuadorEgypt, Arab Rep.El SalvadorEquatorial GuineaEritreaEstoniaEthiopiaEuro areaEurope & Central AsiaEurope & Central Asia (excluding high income)Europe & Central Asia (IDA & IBRD countries)European UnionFaroe IslandsFijiFinlandFragile and conflict affected situationsFranceFrench PolynesiaGabonGambia, TheGeorgiaGermanyGhanaGreeceGrenadaGuatemalaGuineaGuinea-BissauGuyanaHaitiHeavily indebted poor countries (HIPC)High incomeHondurasHong Kong SAR, ChinaHungaryIBRD onlyIcelandIDA & IBRD totalIDA blendIDA onlyIDA totalIndiaIndonesiaIran, Islamic Rep.IraqIrelandIsraelItalyJamaicaJapanJordanKazakhstanKenyaKiribatiKorea, Rep.KosovoKuwaitKyrgyz RepublicLao PDRLate-demographic dividendLatin America & Caribbean Latin America & Caribbean (excluding high income)Latin America & the Caribbean (IDA & IBRD countries)LatviaLeast developed countries: UN classificationLebanonLesothoLiberiaLibyaLithuaniaLow & middle incomeLow incomeLower middle incomeLuxembourgMacao SAR, ChinaMacedonia, FYRMadagascarMalawiMalaysiaMaldivesMaliMaltaMarshall IslandsMauritaniaMauritiusMexicoMicronesia, Fed. Sts.Middle East & North AfricaMiddle East & North Africa (excluding high income)Middle East & North Africa (IDA & IBRD countries)Middle incomeMoldovaMongoliaMontenegroMoroccoMozambiqueMyanmarNamibiaNepalNetherlandsNew CaledoniaNew ZealandNicaraguaNigerNigeriaNorth AmericaNorwayOECD membersOmanOther small statesPacific island small statesPakistanPalauPanamaPapua New GuineaParaguayPeruPhilippinesPolandPortugalPost-demographic dividendPre-demographic dividendQatarRomaniaRussian FederationRwandaSamoaSao Tome and PrincipeSaudi ArabiaSenegalSerbiaSeychellesSierra LeoneSingaporeSint Maarten (Dutch part)Slovak RepublicSloveniaSmall statesSolomon IslandsSouth AfricaSouth AsiaSouth Asia (IDA & IBRD)South SudanSpainSri LankaSt. Kitts and NevisSt. LuciaSt. Vincent and the GrenadinesSub-Saharan Africa Sub-Saharan Africa (excluding high income)Sub-Saharan Africa (IDA & IBRD countries)SudanSurinameSwazilandSwedenSwitzerlandSyrian Arab RepublicTajikistanTanzaniaThailandTimor-LesteTogoTongaTrinidad and TobagoTunisiaTurkeyTuvaluUgandaUkraineUnited KingdomUnited StatesUpper middle incomeUruguayVanuatuVenezuela, RBVietnamWest Bank and GazaWorldYemen, Rep.ZambiaZimbabwe Timeline:
This timeline shows a graph from 1989 to 2016 of Lao PDR. No data until 1988. Number of actual observations by date: 28.
Source name:
World Development Indicators
Source organization:
International Monetary Fund, Balance of Payments Statistics Yearbook and data files.
Categories, topics:
Economy & Growth
Last updated:
apr 23, 2017
Indicators value changes by year
Minimum:
400.0K
jan 1, 1989
Maximum:
102.27 mln
jan 1, 2016
At the date of observation
Value
Absolute change
Change from previous value
jan 1, 1989
400.0K
+400.0K
0.0%
jan 1, 1990
800.0K
+400.0K
100.0%
jan 1, 1991
2.2 mln
+1.4 mln
175.0%
jan 1, 1992
3.3 mln
+1.1 mln
50.0%
jan 1, 1993
5.6 mln
+2.3 mln
69.7%
jan 1, 1994
8.6 mln
+3.0 mln
53.57%
jan 1, 1995
7.2 mln
-1.4 mln
-16.28%
jan 1, 1996
7.4 mln
+200.0K
2.78%
jan 1, 1997
9.2 mln
+1.8 mln
24.32%
jan 1, 1998
11.1 mln
+1.9 mln
20.65%
jan 1, 1999
6.9 mln
-4.2 mln
-37.84%
jan 1, 2000
10.5 mln
+3.6 mln
52.17%
jan 1, 2001
7.3 mln
-3.2 mln
-30.48%
jan 1, 2002
5.825 mln
-1.475 mln
-20.21%
jan 1, 2003
4.709 mln
-1.115 mln
-19.15%
jan 1, 2004
3.559 mln
-1.15 mln
-24.43%
jan 1, 2005
3.96 mln
+401.505K
11.28%
jan 1, 2006
5.03 mln
+1.07 mln
27.01%
jan 1, 2007
16.228 mln
+11.198 mln
222.63%
jan 1, 2008
43.65 mln
+27.421 mln
168.97%
jan 1, 2009
32.07 mln
-11.579 mln
-26.53%
jan 1, 2010
41.734 mln
+9.664 mln
30.13%
jan 1, 2011
50.288 mln
+8.554 mln
20.5%
jan 1, 2012
48.331 mln
-1.957 mln
-3.89%
jan 1, 2013
69.146 mln
+20.815 mln
43.07%
jan 1, 2014
72.716 mln
+3.57 mln
5.16%
jan 1, 2015
47.124 mln
-25.592 mln
-35.19%
jan 1, 2016
102.27 mln
+55.146 mln
117.02%
Ranking of countries by current statistics by years


Comments: