29
/
en
AIzaSyAYiBZKx7MnpbEhh9jyipgxe19OcubqV5w
April 1, 2024
38525
IDA blend
IDB
false
2
1
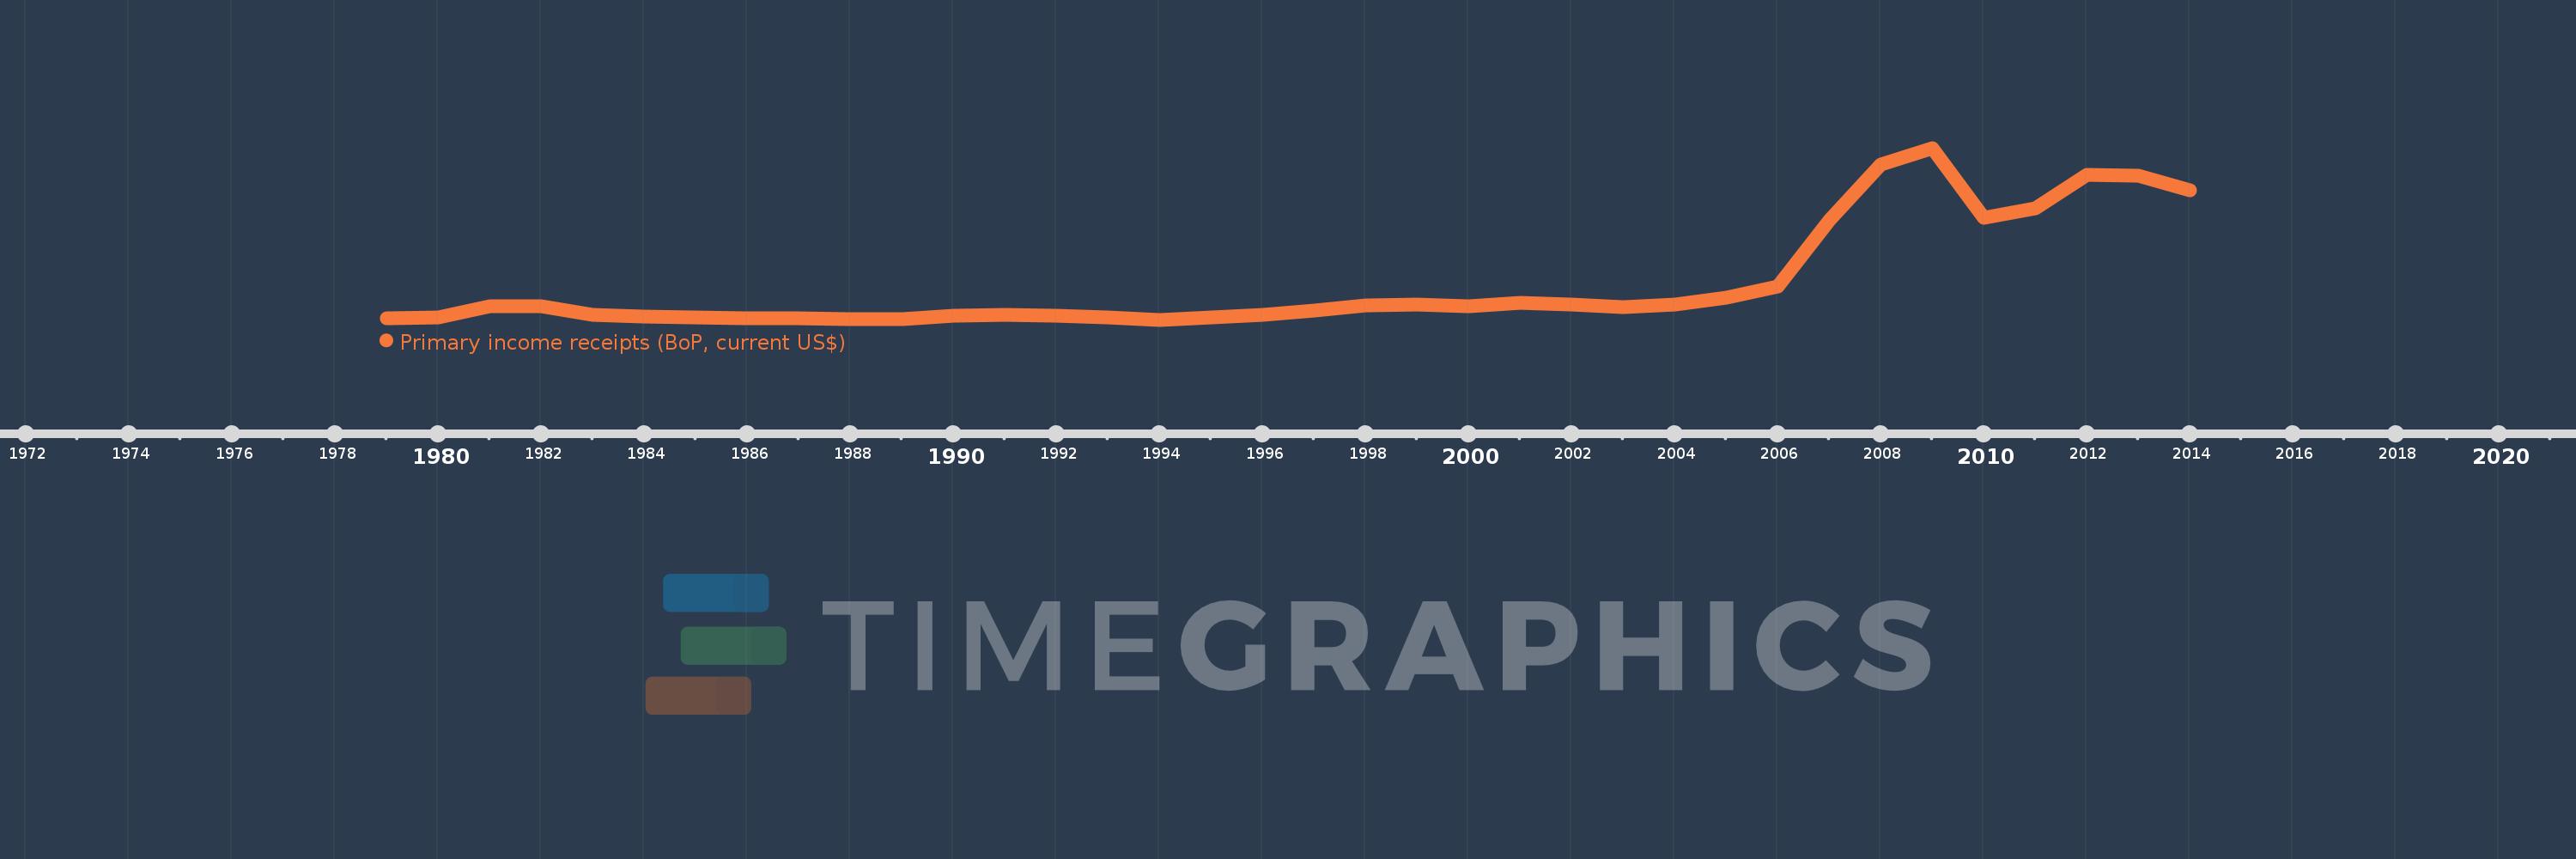
Primary income receipts (BoP, current US$)
2014,2013,2012,2011,2010,2009,2008,2007,2006,2005,2004,2003,2002,2001,2000,1999,1998,1997,1996,1995,1994,1993,1992,1991,1990,1989,1988,1987,1986,1984,1983,1982,1981,1980,1979
This statistics in other country:
AfghanistanAlbaniaAlgeriaAngolaAntigua and BarbudaArab WorldArgentinaArmeniaArubaAustraliaAustriaAzerbaijanBahamas, TheBahrainBangladeshBarbadosBelarusBelgiumBelizeBeninBermudaBhutanBoliviaBosnia and HerzegovinaBotswanaBrazilBrunei DarussalamBulgariaBurkina FasoBurundiCabo VerdeCambodiaCameroonCanadaCaribbean small statesCentral African RepublicCentral Europe and the BalticsChadChileChinaColombiaComorosCongo, Dem. Rep.Congo, Rep.Costa RicaCote d'IvoireCroatiaCuracaoCyprusCzech RepublicDenmarkDjiboutiDominicaDominican RepublicEarly-demographic dividendEast Asia & PacificEast Asia & Pacific (excluding high income)East Asia & Pacific (IDA & IBRD countries)EcuadorEgypt, Arab Rep.El SalvadorEquatorial GuineaEritreaEstoniaEthiopiaEuro areaEurope & Central AsiaEurope & Central Asia (excluding high income)Europe & Central Asia (IDA & IBRD countries)European UnionFaroe IslandsFijiFinlandFragile and conflict affected situationsFranceFrench PolynesiaGabonGambia, TheGeorgiaGermanyGhanaGreeceGrenadaGuatemalaGuineaGuinea-BissauGuyanaHaitiHeavily indebted poor countries (HIPC)High incomeHondurasHong Kong SAR, ChinaHungaryIBRD onlyIcelandIDA & IBRD totalIDA blendIDA onlyIDA totalIndiaIndonesiaIran, Islamic Rep.IraqIrelandIsraelItalyJamaicaJapanJordanKazakhstanKenyaKiribatiKorea, Rep.KosovoKuwaitKyrgyz RepublicLao PDRLate-demographic dividendLatin America & Caribbean Latin America & Caribbean (excluding high income)Latin America & the Caribbean (IDA & IBRD countries)LatviaLeast developed countries: UN classificationLebanonLesothoLiberiaLibyaLithuaniaLow & middle incomeLow incomeLower middle incomeLuxembourgMacao SAR, ChinaMacedonia, FYRMadagascarMalawiMalaysiaMaldivesMaliMaltaMarshall IslandsMauritaniaMauritiusMexicoMicronesia, Fed. Sts.Middle East & North AfricaMiddle East & North Africa (excluding high income)Middle East & North Africa (IDA & IBRD countries)Middle incomeMoldovaMongoliaMontenegroMoroccoMozambiqueMyanmarNamibiaNepalNetherlandsNew CaledoniaNew ZealandNicaraguaNigerNigeriaNorth AmericaNorwayOECD membersOmanOther small statesPacific island small statesPakistanPalauPanamaPapua New GuineaParaguayPeruPhilippinesPolandPortugalPost-demographic dividendPre-demographic dividendQatarRomaniaRussian FederationRwandaSamoaSao Tome and PrincipeSaudi ArabiaSenegalSerbiaSeychellesSierra LeoneSingaporeSint Maarten (Dutch part)Slovak RepublicSloveniaSmall statesSolomon IslandsSouth AfricaSouth AsiaSouth Asia (IDA & IBRD)South SudanSpainSri LankaSt. Kitts and NevisSt. LuciaSt. Vincent and the GrenadinesSub-Saharan Africa Sub-Saharan Africa (excluding high income)Sub-Saharan Africa (IDA & IBRD countries)SudanSurinameSwazilandSwedenSwitzerlandSyrian Arab RepublicTajikistanTanzaniaThailandTimor-LesteTogoTongaTrinidad and TobagoTunisiaTurkeyTuvaluUgandaUkraineUnited KingdomUnited StatesUpper middle incomeUruguayVanuatuVenezuela, RBVietnamWest Bank and GazaWorldYemen, Rep.ZambiaZimbabwe Timeline:
This timeline shows a graph from 1979 to 2014 of IDA blend. No data until 1978. Number of actual observations by date: 35.
Source name:
World Development Indicators
Source organization:
International Monetary Fund, Balance of Payments Statistics Yearbook and data files.
Categories, topics:
Economy & Growth
Last updated:
apr 23, 2017
Indicators value changes by year
Minimum:
354.175 mln
jan 1, 1994
Maximum:
9.143 bln
jan 1, 2009
At the date of observation
Value
Absolute change
Change from previous value
jan 1, 1979
449.679 mln
+449.679 mln
0.0%
jan 1, 1980
481.956 mln
+32.276 mln
7.18%
jan 1, 1981
1.053 bln
+571.449 mln
118.57%
jan 1, 1982
1.058 bln
+4.63 mln
0.44%
jan 1, 1983
584.601 mln
-473.435 mln
-44.75%
jan 1, 1984
520.203 mln
-64.397 mln
-11.02%
jan 1, 1986
437.832 mln
-82.371 mln
-15.83%
jan 1, 1987
434.113 mln
-3.719 mln
-0.85%
jan 1, 1988
398.215 mln
-35.898 mln
-8.27%
jan 1, 1989
405.464 mln
+7.249 mln
1.82%
jan 1, 1990
540.054 mln
+134.59 mln
33.19%
jan 1, 1991
600.238 mln
+60.185 mln
11.14%
jan 1, 1992
554.94 mln
-45.298 mln
-7.55%
jan 1, 1993
477.05 mln
-77.89 mln
-14.04%
jan 1, 1994
354.175 mln
-122.875 mln
-25.76%
jan 1, 1995
466.632 mln
+112.457 mln
31.75%
jan 1, 1996
621.707 mln
+155.074 mln
33.23%
jan 1, 1997
843.609 mln
+221.902 mln
35.69%
jan 1, 1998
1.091 bln
+247.0 mln
29.28%
jan 1, 1999
1.129 bln
+38.804 mln
3.56%
jan 1, 2000
1.054 bln
-75.093 mln
-6.65%
jan 1, 2001
1.201 bln
+147.013 mln
13.94%
jan 1, 2002
1.15 bln
-51.116 mln
-4.25%
jan 1, 2003
996.999 mln
-153.218 mln
-13.32%
jan 1, 2004
1.148 bln
+150.954 mln
15.14%
jan 1, 2005
1.482 bln
+334.332 mln
29.12%
jan 1, 2006
2.066 bln
+583.66 mln
39.38%
jan 1, 2007
5.43 bln
+3.365 bln
162.86%
jan 1, 2008
8.277 bln
+2.846 bln
52.42%
jan 1, 2009
9.143 bln
+866.277 mln
10.47%
jan 1, 2010
5.576 bln
-3.568 bln
-39.02%
jan 1, 2011
6.052 bln
+476.587 mln
8.55%
jan 1, 2012
7.748 bln
+1.696 bln
28.02%
jan 1, 2013
7.731 bln
-16.325 mln
-0.21%
jan 1, 2014
6.977 bln
-754.288 mln
-9.76%
Ranking of countries by current statistics by years


Comments: