29
/
en
AIzaSyAYiBZKx7MnpbEhh9jyipgxe19OcubqV5w
April 1, 2024
47647
Lower middle income
LMC
false
2
1
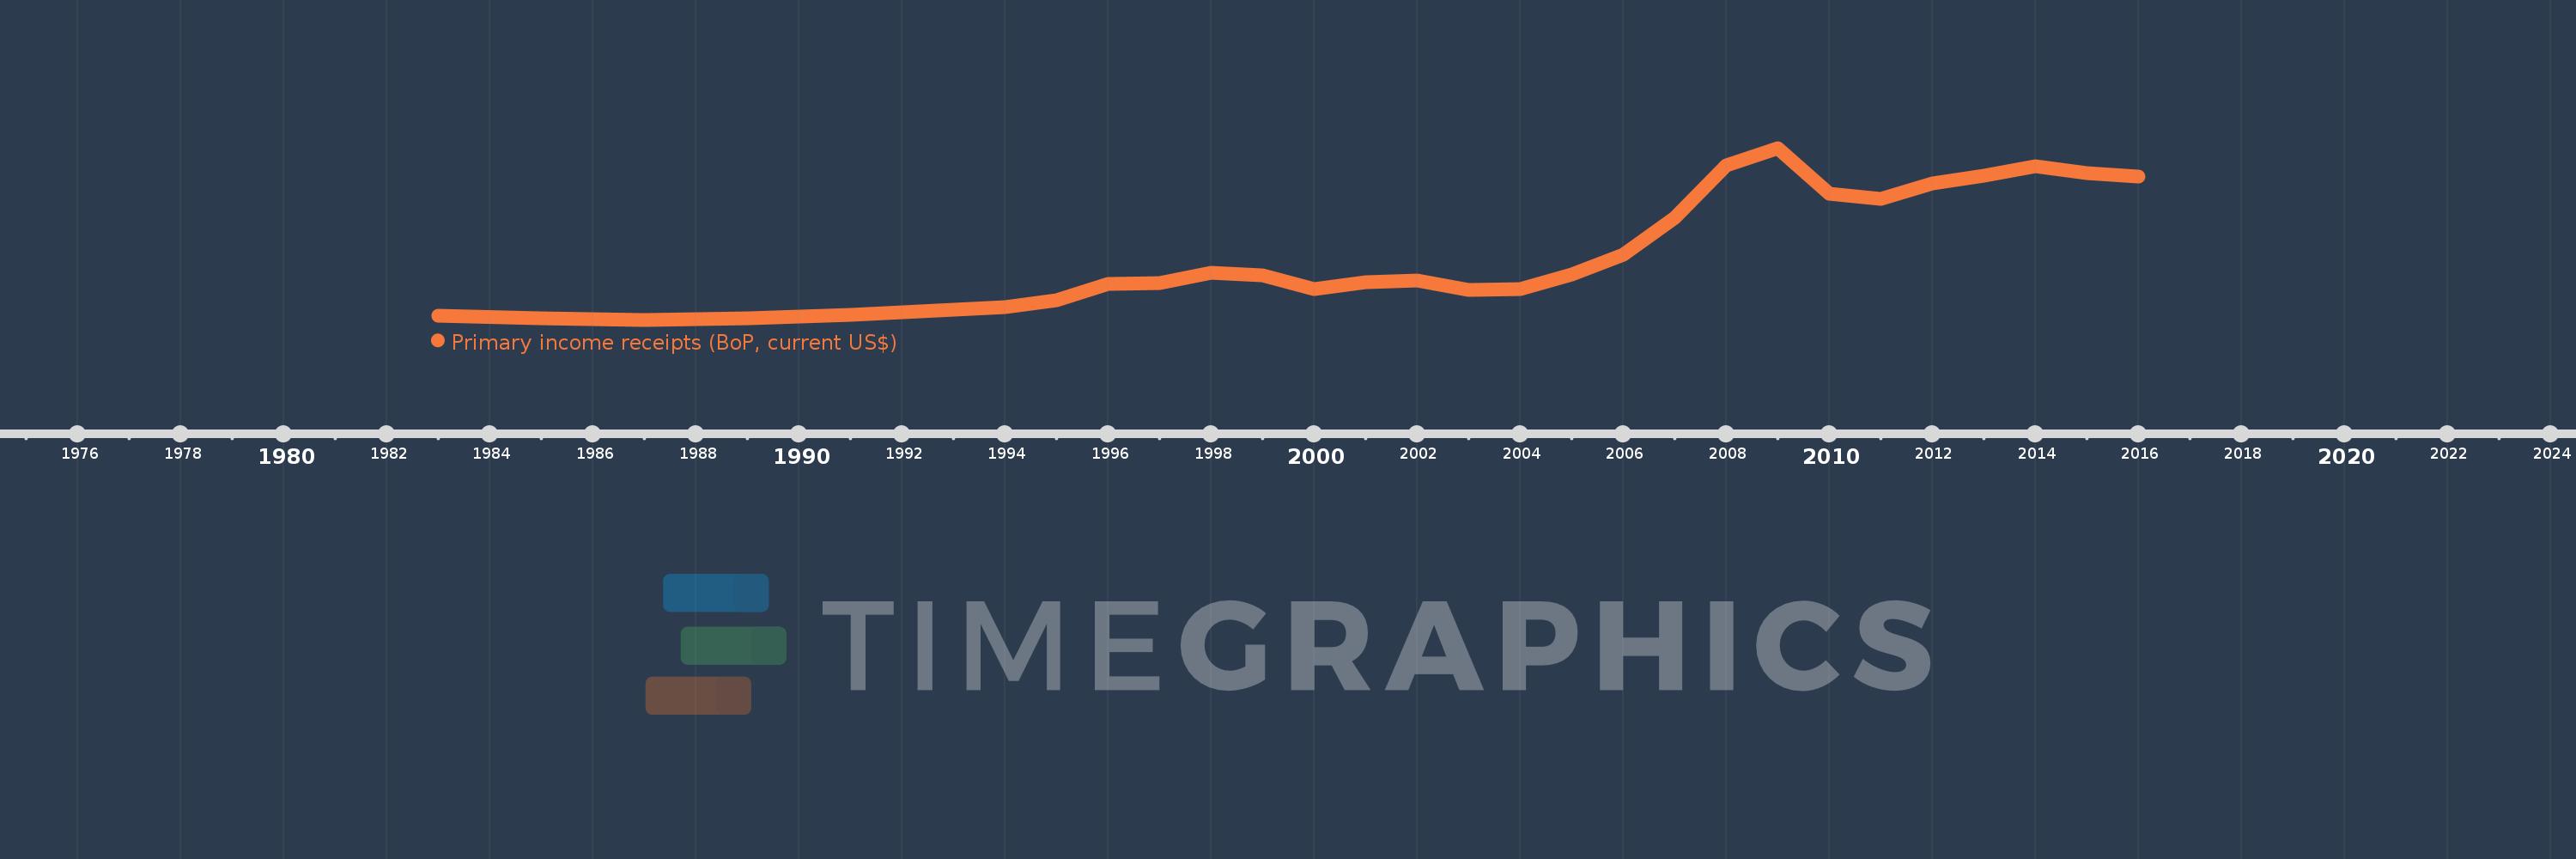
Primary income receipts (BoP, current US$)
2016,2015,2014,2013,2012,2011,2010,2009,2008,2007,2006,2005,2004,2003,2002,2001,2000,1999,1998,1997,1996,1995,1994,1992,1991,1990,1989,1988,1987,1986,1985,1983
This statistics in other country:
AfghanistanAlbaniaAlgeriaAngolaAntigua and BarbudaArab WorldArgentinaArmeniaArubaAustraliaAustriaAzerbaijanBahamas, TheBahrainBangladeshBarbadosBelarusBelgiumBelizeBeninBermudaBhutanBoliviaBosnia and HerzegovinaBotswanaBrazilBrunei DarussalamBulgariaBurkina FasoBurundiCabo VerdeCambodiaCameroonCanadaCaribbean small statesCentral African RepublicCentral Europe and the BalticsChadChileChinaColombiaComorosCongo, Dem. Rep.Congo, Rep.Costa RicaCote d'IvoireCroatiaCuracaoCyprusCzech RepublicDenmarkDjiboutiDominicaDominican RepublicEarly-demographic dividendEast Asia & PacificEast Asia & Pacific (excluding high income)East Asia & Pacific (IDA & IBRD countries)EcuadorEgypt, Arab Rep.El SalvadorEquatorial GuineaEritreaEstoniaEthiopiaEuro areaEurope & Central AsiaEurope & Central Asia (excluding high income)Europe & Central Asia (IDA & IBRD countries)European UnionFaroe IslandsFijiFinlandFragile and conflict affected situationsFranceFrench PolynesiaGabonGambia, TheGeorgiaGermanyGhanaGreeceGrenadaGuatemalaGuineaGuinea-BissauGuyanaHaitiHeavily indebted poor countries (HIPC)High incomeHondurasHong Kong SAR, ChinaHungaryIBRD onlyIcelandIDA & IBRD totalIDA blendIDA onlyIDA totalIndiaIndonesiaIran, Islamic Rep.IraqIrelandIsraelItalyJamaicaJapanJordanKazakhstanKenyaKiribatiKorea, Rep.KosovoKuwaitKyrgyz RepublicLao PDRLate-demographic dividendLatin America & Caribbean Latin America & Caribbean (excluding high income)Latin America & the Caribbean (IDA & IBRD countries)LatviaLeast developed countries: UN classificationLebanonLesothoLiberiaLibyaLithuaniaLow & middle incomeLow incomeLower middle incomeLuxembourgMacao SAR, ChinaMacedonia, FYRMadagascarMalawiMalaysiaMaldivesMaliMaltaMarshall IslandsMauritaniaMauritiusMexicoMicronesia, Fed. Sts.Middle East & North AfricaMiddle East & North Africa (excluding high income)Middle East & North Africa (IDA & IBRD countries)Middle incomeMoldovaMongoliaMontenegroMoroccoMozambiqueMyanmarNamibiaNepalNetherlandsNew CaledoniaNew ZealandNicaraguaNigerNigeriaNorth AmericaNorwayOECD membersOmanOther small statesPacific island small statesPakistanPalauPanamaPapua New GuineaParaguayPeruPhilippinesPolandPortugalPost-demographic dividendPre-demographic dividendQatarRomaniaRussian FederationRwandaSamoaSao Tome and PrincipeSaudi ArabiaSenegalSerbiaSeychellesSierra LeoneSingaporeSint Maarten (Dutch part)Slovak RepublicSloveniaSmall statesSolomon IslandsSouth AfricaSouth AsiaSouth Asia (IDA & IBRD)South SudanSpainSri LankaSt. Kitts and NevisSt. LuciaSt. Vincent and the GrenadinesSub-Saharan Africa Sub-Saharan Africa (excluding high income)Sub-Saharan Africa (IDA & IBRD countries)SudanSurinameSwazilandSwedenSwitzerlandSyrian Arab RepublicTajikistanTanzaniaThailandTimor-LesteTogoTongaTrinidad and TobagoTunisiaTurkeyTuvaluUgandaUkraineUnited KingdomUnited StatesUpper middle incomeUruguayVanuatuVenezuela, RBVietnamWest Bank and GazaWorldYemen, Rep.ZambiaZimbabwe Timeline:
This timeline shows a graph from 1983 to 2016 of Lower middle income. No data until 1982. Number of actual observations by date: 32.
Source name:
World Development Indicators
Source organization:
International Monetary Fund, Balance of Payments Statistics Yearbook and data files.
Categories, topics:
Economy & Growth
Last updated:
apr 23, 2017
Indicators value changes by year
Minimum:
3.918 bln
jan 1, 1987
Maximum:
51.786 bln
jan 1, 2009
At the date of observation
Value
Absolute change
Change from previous value
jan 1, 1983
4.975 bln
+4.975 bln
0.0%
jan 1, 1985
4.415 bln
-560.204 mln
-11.26%
jan 1, 1986
4.159 bln
-255.329 mln
-5.78%
jan 1, 1987
3.918 bln
-241.785 mln
-5.81%
jan 1, 1988
4.08 bln
+162.52 mln
4.15%
jan 1, 1989
4.224 bln
+144.115 mln
3.53%
jan 1, 1990
4.918 bln
+694.009 mln
16.43%
jan 1, 1991
5.292 bln
+373.823 mln
7.6%
jan 1, 1992
6.106 bln
+814.069 mln
15.38%
jan 1, 1994
7.326 bln
+1.22 bln
19.98%
jan 1, 1995
9.318 bln
+1.992 bln
27.19%
jan 1, 1996
13.982 bln
+4.663 bln
50.04%
jan 1, 1997
14.109 bln
+127.251 mln
0.91%
jan 1, 1998
17.072 bln
+2.963 bln
21.0%
jan 1, 1999
16.322 bln
-750.245 mln
-4.39%
jan 1, 2000
12.383 bln
-3.939 bln
-24.13%
jan 1, 2001
14.448 bln
+2.065 bln
16.68%
jan 1, 2002
14.762 bln
+314.674 mln
2.18%
jan 1, 2003
12.144 bln
-2.618 bln
-17.74%
jan 1, 2004
12.556 bln
+411.406 mln
3.39%
jan 1, 2005
16.627 bln
+4.072 bln
32.43%
jan 1, 2006
21.982 bln
+5.355 bln
32.21%
jan 1, 2007
32.323 bln
+10.341 bln
47.04%
jan 1, 2008
46.823 bln
+14.499 bln
44.86%
jan 1, 2009
51.786 bln
+4.964 bln
10.6%
jan 1, 2010
39.113 bln
-12.674 bln
-24.47%
jan 1, 2011
37.498 bln
-1.615 bln
-4.13%
jan 1, 2012
41.873 bln
+4.376 bln
11.67%
jan 1, 2013
44.112 bln
+2.239 bln
5.35%
jan 1, 2014
46.579 bln
+2.466 bln
5.59%
jan 1, 2015
44.704 bln
-1.875 bln
-4.03%
jan 1, 2016
43.933 bln
-770.47 mln
-1.72%
Ranking of countries by current statistics by years


Comments: