29
/
en
AIzaSyAYiBZKx7MnpbEhh9jyipgxe19OcubqV5w
April 1, 2024
61131
Sub-Saharan Africa (IDA & IBRD countries)
TSS
false
2
1
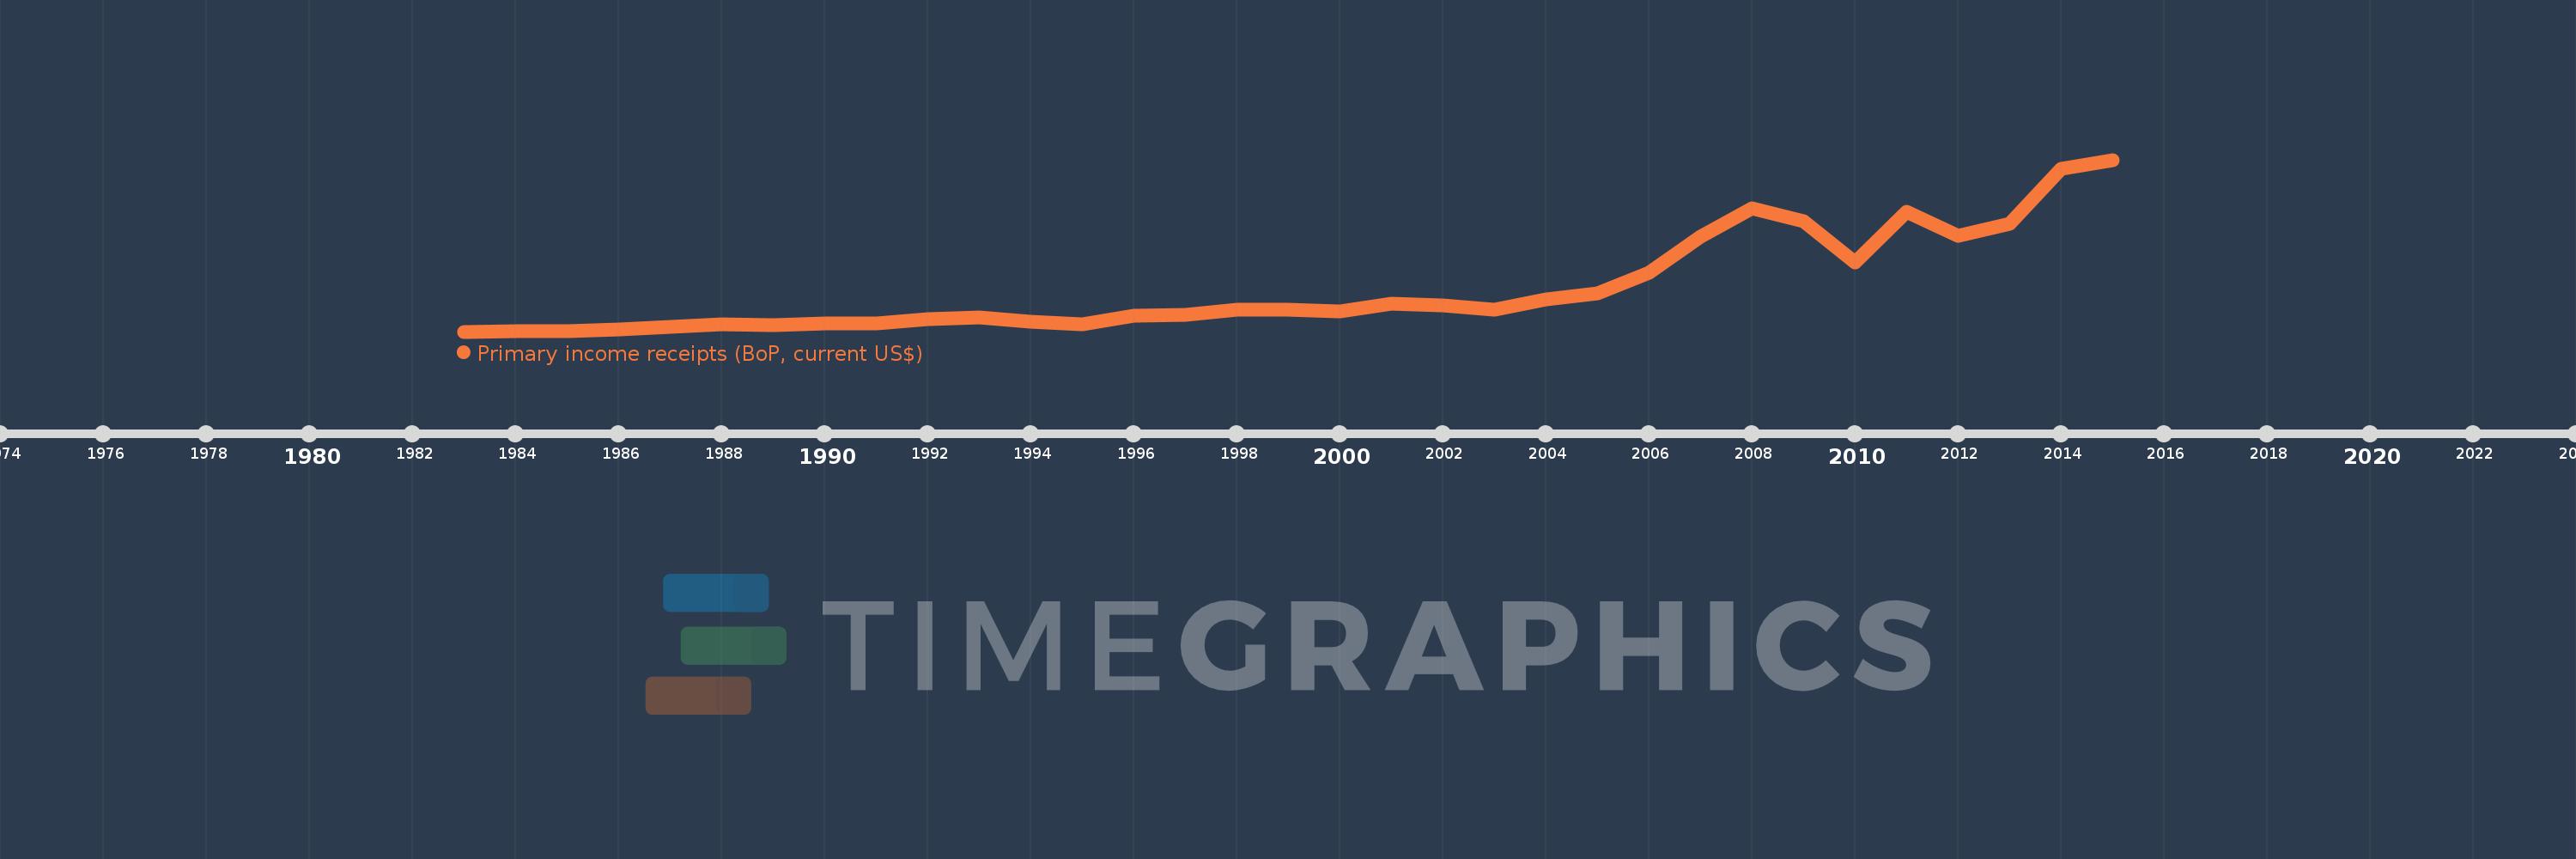
Primary income receipts (BoP, current US$)
2015,2014,2013,2012,2011,2010,2009,2008,2007,2006,2005,2004,2003,2002,2001,2000,1999,1998,1997,1996,1995,1994,1993,1992,1991,1990,1989,1988,1987,1986,1985,1984,1983
This statistics in other country:
AfghanistanAlbaniaAlgeriaAngolaAntigua and BarbudaArab WorldArgentinaArmeniaArubaAustraliaAustriaAzerbaijanBahamas, TheBahrainBangladeshBarbadosBelarusBelgiumBelizeBeninBermudaBhutanBoliviaBosnia and HerzegovinaBotswanaBrazilBrunei DarussalamBulgariaBurkina FasoBurundiCabo VerdeCambodiaCameroonCanadaCaribbean small statesCentral African RepublicCentral Europe and the BalticsChadChileChinaColombiaComorosCongo, Dem. Rep.Congo, Rep.Costa RicaCote d'IvoireCroatiaCuracaoCyprusCzech RepublicDenmarkDjiboutiDominicaDominican RepublicEarly-demographic dividendEast Asia & PacificEast Asia & Pacific (excluding high income)East Asia & Pacific (IDA & IBRD countries)EcuadorEgypt, Arab Rep.El SalvadorEquatorial GuineaEritreaEstoniaEthiopiaEuro areaEurope & Central AsiaEurope & Central Asia (excluding high income)Europe & Central Asia (IDA & IBRD countries)European UnionFaroe IslandsFijiFinlandFragile and conflict affected situationsFranceFrench PolynesiaGabonGambia, TheGeorgiaGermanyGhanaGreeceGrenadaGuatemalaGuineaGuinea-BissauGuyanaHaitiHeavily indebted poor countries (HIPC)High incomeHondurasHong Kong SAR, ChinaHungaryIBRD onlyIcelandIDA & IBRD totalIDA blendIDA onlyIDA totalIndiaIndonesiaIran, Islamic Rep.IraqIrelandIsraelItalyJamaicaJapanJordanKazakhstanKenyaKiribatiKorea, Rep.KosovoKuwaitKyrgyz RepublicLao PDRLate-demographic dividendLatin America & Caribbean Latin America & Caribbean (excluding high income)Latin America & the Caribbean (IDA & IBRD countries)LatviaLeast developed countries: UN classificationLebanonLesothoLiberiaLibyaLithuaniaLow & middle incomeLow incomeLower middle incomeLuxembourgMacao SAR, ChinaMacedonia, FYRMadagascarMalawiMalaysiaMaldivesMaliMaltaMarshall IslandsMauritaniaMauritiusMexicoMicronesia, Fed. Sts.Middle East & North AfricaMiddle East & North Africa (excluding high income)Middle East & North Africa (IDA & IBRD countries)Middle incomeMoldovaMongoliaMontenegroMoroccoMozambiqueMyanmarNamibiaNepalNetherlandsNew CaledoniaNew ZealandNicaraguaNigerNigeriaNorth AmericaNorwayOECD membersOmanOther small statesPacific island small statesPakistanPalauPanamaPapua New GuineaParaguayPeruPhilippinesPolandPortugalPost-demographic dividendPre-demographic dividendQatarRomaniaRussian FederationRwandaSamoaSao Tome and PrincipeSaudi ArabiaSenegalSerbiaSeychellesSierra LeoneSingaporeSint Maarten (Dutch part)Slovak RepublicSloveniaSmall statesSolomon IslandsSouth AfricaSouth AsiaSouth Asia (IDA & IBRD)South SudanSpainSri LankaSt. Kitts and NevisSt. LuciaSt. Vincent and the GrenadinesSub-Saharan Africa Sub-Saharan Africa (excluding high income)Sub-Saharan Africa (IDA & IBRD countries)SudanSurinameSwazilandSwedenSwitzerlandSyrian Arab RepublicTajikistanTanzaniaThailandTimor-LesteTogoTongaTrinidad and TobagoTunisiaTurkeyTuvaluUgandaUkraineUnited KingdomUnited StatesUpper middle incomeUruguayVanuatuVenezuela, RBVietnamWest Bank and GazaWorldYemen, Rep.ZambiaZimbabwe Timeline:
This timeline shows a graph from 1983 to 2015 of Sub-Saharan Africa (IDA & IBRD countries). No data until 1982. Number of actual observations by date: 33.
Source name:
World Development Indicators
Source organization:
International Monetary Fund, Balance of Payments Statistics Yearbook and data files.
Categories, topics:
Economy & Growth
Last updated:
apr 23, 2017
Indicators value changes by year
Minimum:
1.578 bln
jan 1, 1983
Maximum:
19.982 bln
jan 1, 2015
At the date of observation
Value
Absolute change
Change from previous value
jan 1, 1983
1.578 bln
+1.578 bln
0.0%
jan 1, 1984
1.639 bln
+60.832 mln
3.86%
jan 1, 1985
1.604 bln
-34.864 mln
-2.13%
jan 1, 1986
1.78 bln
+175.703 mln
10.96%
jan 1, 1987
2.042 bln
+262.959 mln
14.78%
jan 1, 1988
2.36 bln
+317.093 mln
15.52%
jan 1, 1989
2.284 bln
-75.954 mln
-3.22%
jan 1, 1990
2.471 bln
+187.026 mln
8.19%
jan 1, 1991
2.463 bln
-7.977 mln
-0.32%
jan 1, 1992
2.931 bln
+468.395 mln
19.02%
jan 1, 1993
3.079 bln
+147.601 mln
5.04%
jan 1, 1994
2.658 bln
-420.57 mln
-13.66%
jan 1, 1995
2.399 bln
-258.667 mln
-9.73%
jan 1, 1996
3.266 bln
+866.484 mln
36.11%
jan 1, 1997
3.335 bln
+69.4 mln
2.12%
jan 1, 1998
3.884 bln
+548.328 mln
16.44%
jan 1, 1999
3.945 bln
+60.917 mln
1.57%
jan 1, 2000
3.786 bln
-158.525 mln
-4.02%
jan 1, 2001
4.605 bln
+819.26 mln
21.64%
jan 1, 2002
4.399 bln
-206.114 mln
-4.48%
jan 1, 2003
3.968 bln
-431.501 mln
-9.81%
jan 1, 2004
5.021 bln
+1.053 bln
26.55%
jan 1, 2005
5.632 bln
+610.631 mln
12.16%
jan 1, 2006
7.918 bln
+2.287 bln
40.61%
jan 1, 2007
11.76 bln
+3.842 bln
48.52%
jan 1, 2008
14.824 bln
+3.063 bln
26.05%
jan 1, 2009
13.414 bln
-1.41 bln
-9.51%
jan 1, 2010
8.967 bln
-4.447 bln
-33.15%
jan 1, 2011
14.444 bln
+5.476 bln
61.07%
jan 1, 2012
11.8 bln
-2.644 bln
-18.31%
jan 1, 2013
13.147 bln
+1.348 bln
11.42%
jan 1, 2014
19.044 bln
+5.897 bln
44.85%
jan 1, 2015
19.982 bln
+937.512 mln
4.92%
Ranking of countries by current statistics by years


Comments: