29
/
en
AIzaSyAYiBZKx7MnpbEhh9jyipgxe19OcubqV5w
April 1, 2024
286507
Zambia
ZMB
true
2
1
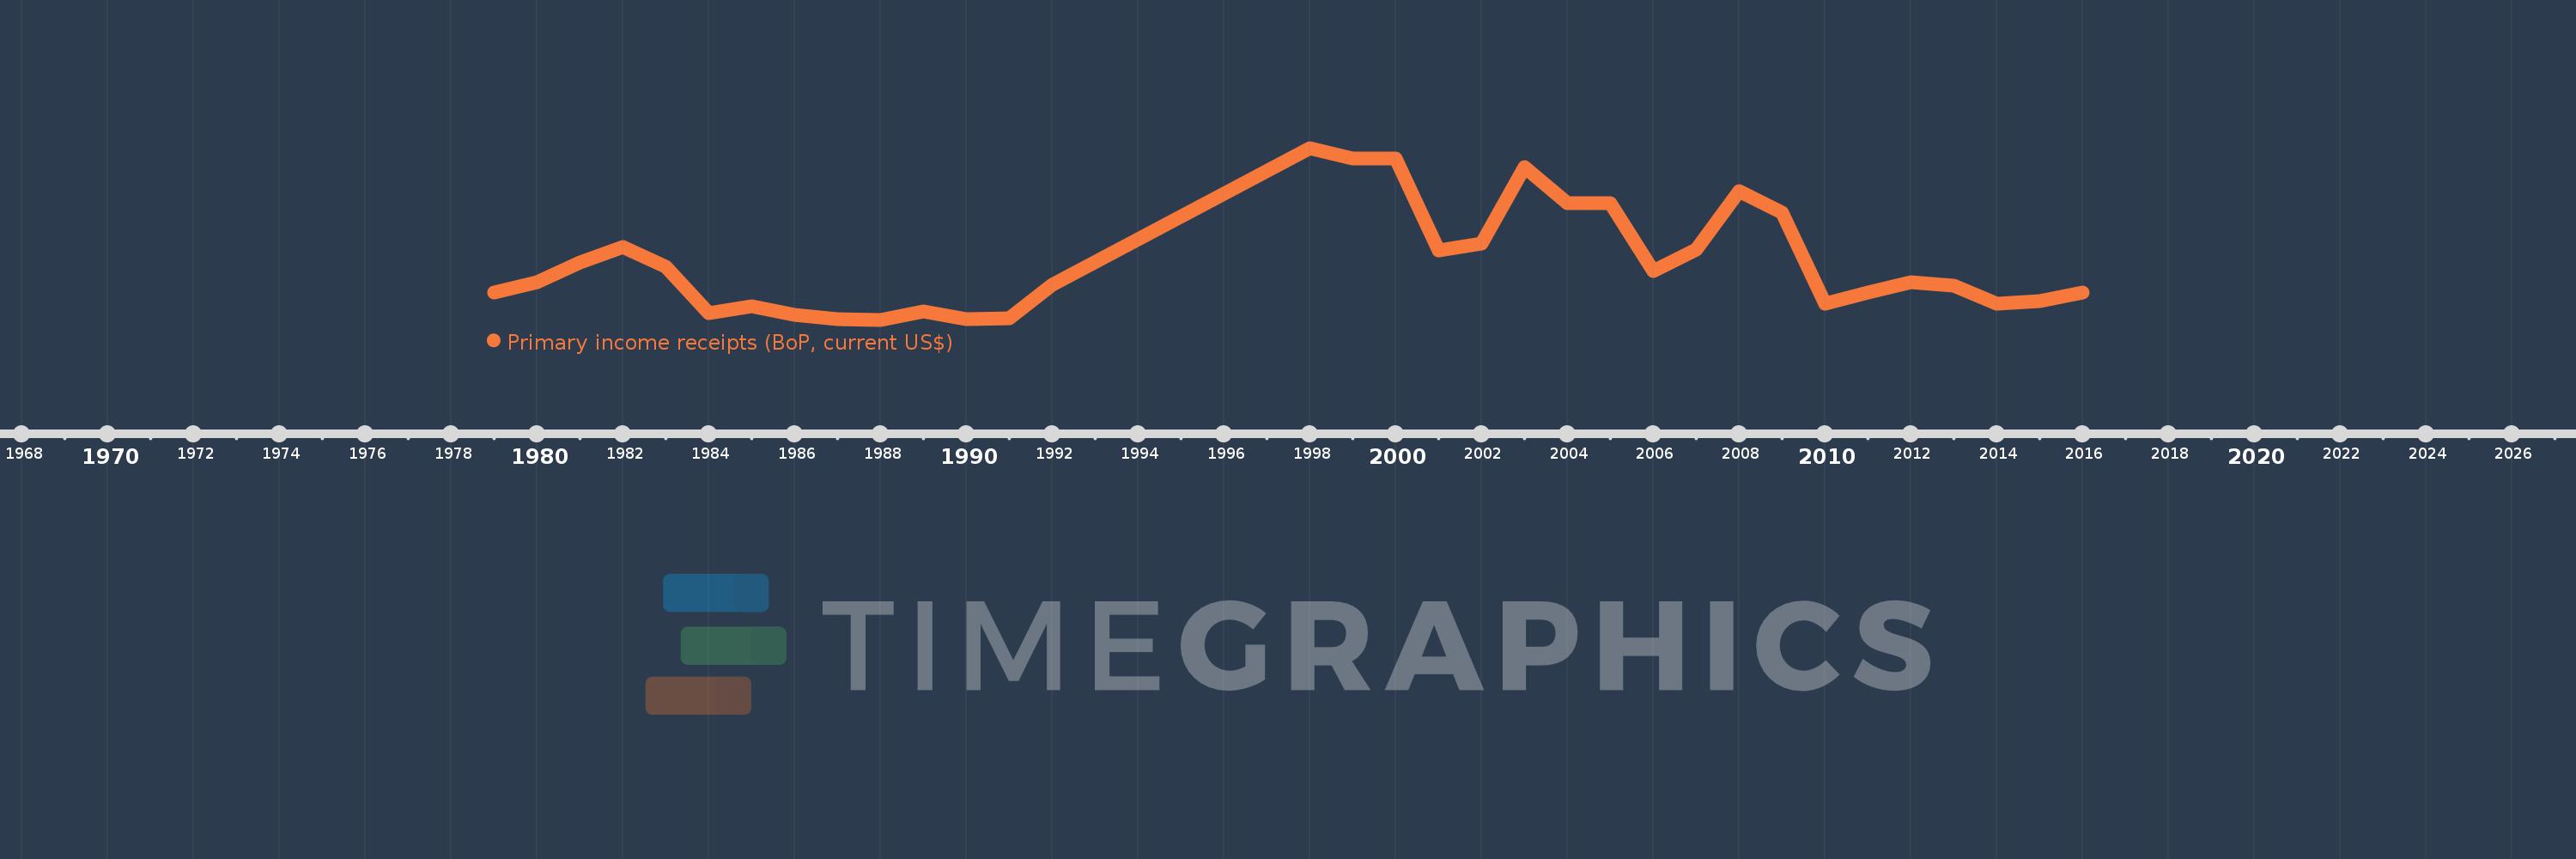
Primary income receipts (BoP, current US$)
2016,2015,2014,2013,2012,2011,2010,2009,2008,2007,2006,2005,2004,2003,2002,2001,2000,1999,1998,1992,1991,1990,1989,1988,1987,1986,1985,1984,1983,1982,1981,1980,1979
This statistics in other country:
AfghanistanAlbaniaAlgeriaAngolaAntigua and BarbudaArab WorldArgentinaArmeniaArubaAustraliaAustriaAzerbaijanBahamas, TheBahrainBangladeshBarbadosBelarusBelgiumBelizeBeninBermudaBhutanBoliviaBosnia and HerzegovinaBotswanaBrazilBrunei DarussalamBulgariaBurkina FasoBurundiCabo VerdeCambodiaCameroonCanadaCaribbean small statesCentral African RepublicCentral Europe and the BalticsChadChileChinaColombiaComorosCongo, Dem. Rep.Congo, Rep.Costa RicaCote d'IvoireCroatiaCuracaoCyprusCzech RepublicDenmarkDjiboutiDominicaDominican RepublicEarly-demographic dividendEast Asia & PacificEast Asia & Pacific (excluding high income)East Asia & Pacific (IDA & IBRD countries)EcuadorEgypt, Arab Rep.El SalvadorEquatorial GuineaEritreaEstoniaEthiopiaEuro areaEurope & Central AsiaEurope & Central Asia (excluding high income)Europe & Central Asia (IDA & IBRD countries)European UnionFaroe IslandsFijiFinlandFragile and conflict affected situationsFranceFrench PolynesiaGabonGambia, TheGeorgiaGermanyGhanaGreeceGrenadaGuatemalaGuineaGuinea-BissauGuyanaHaitiHeavily indebted poor countries (HIPC)High incomeHondurasHong Kong SAR, ChinaHungaryIBRD onlyIcelandIDA & IBRD totalIDA blendIDA onlyIDA totalIndiaIndonesiaIran, Islamic Rep.IraqIrelandIsraelItalyJamaicaJapanJordanKazakhstanKenyaKiribatiKorea, Rep.KosovoKuwaitKyrgyz RepublicLao PDRLate-demographic dividendLatin America & Caribbean Latin America & Caribbean (excluding high income)Latin America & the Caribbean (IDA & IBRD countries)LatviaLeast developed countries: UN classificationLebanonLesothoLiberiaLibyaLithuaniaLow & middle incomeLow incomeLower middle incomeLuxembourgMacao SAR, ChinaMacedonia, FYRMadagascarMalawiMalaysiaMaldivesMaliMaltaMarshall IslandsMauritaniaMauritiusMexicoMicronesia, Fed. Sts.Middle East & North AfricaMiddle East & North Africa (excluding high income)Middle East & North Africa (IDA & IBRD countries)Middle incomeMoldovaMongoliaMontenegroMoroccoMozambiqueMyanmarNamibiaNepalNetherlandsNew CaledoniaNew ZealandNicaraguaNigerNigeriaNorth AmericaNorwayOECD membersOmanOther small statesPacific island small statesPakistanPalauPanamaPapua New GuineaParaguayPeruPhilippinesPolandPortugalPost-demographic dividendPre-demographic dividendQatarRomaniaRussian FederationRwandaSamoaSao Tome and PrincipeSaudi ArabiaSenegalSerbiaSeychellesSierra LeoneSingaporeSint Maarten (Dutch part)Slovak RepublicSloveniaSmall statesSolomon IslandsSouth AfricaSouth AsiaSouth Asia (IDA & IBRD)South SudanSpainSri LankaSt. Kitts and NevisSt. LuciaSt. Vincent and the GrenadinesSub-Saharan Africa Sub-Saharan Africa (excluding high income)Sub-Saharan Africa (IDA & IBRD countries)SudanSurinameSwazilandSwedenSwitzerlandSyrian Arab RepublicTajikistanTanzaniaThailandTimor-LesteTogoTongaTrinidad and TobagoTunisiaTurkeyTuvaluUgandaUkraineUnited KingdomUnited StatesUpper middle incomeUruguayVanuatuVenezuela, RBVietnamWest Bank and GazaWorldYemen, Rep.ZambiaZimbabwe Timeline:
This timeline shows a graph from 1979 to 2016 of Zambia. No data until 1978. Number of actual observations by date: 33.
Source name:
World Development Indicators
Source organization:
International Monetary Fund, Balance of Payments Statistics Yearbook and data files.
Categories, topics:
Economy & Growth
Last updated:
apr 23, 2017
Indicators value changes by year
Minimum:
1.1 mln
jan 1, 1988
Maximum:
46.7 mln
jan 1, 1998
At the date of observation
Value
Absolute change
Change from previous value
jan 1, 1979
8.4 mln
+8.4 mln
0.0%
jan 1, 1980
11.1 mln
+2.7 mln
32.14%
jan 1, 1981
16.2 mln
+5.1 mln
45.95%
jan 1, 1982
20.4 mln
+4.2 mln
25.93%
jan 1, 1983
15.1 mln
-5.3 mln
-25.98%
jan 1, 1984
2.9 mln
-12.2 mln
-80.79%
jan 1, 1985
4.7 mln
+1.8 mln
62.07%
jan 1, 1986
2.5 mln
-2.2 mln
-46.81%
jan 1, 1987
1.3 mln
-1.2 mln
-48.0%
jan 1, 1988
1.1 mln
-200.0K
-15.38%
jan 1, 1989
3.2 mln
+2.1 mln
190.91%
jan 1, 1990
1.2 mln
-2.0 mln
-62.5%
jan 1, 1991
1.6 mln
+400.0K
33.33%
jan 1, 1992
10.4 mln
+8.8 mln
550.0%
jan 1, 1998
46.7 mln
+36.3 mln
349.04%
jan 1, 1999
43.9 mln
-2.8 mln
-6.0%
jan 1, 2000
43.9 mln
0.0
0.0%
jan 1, 2001
19.4 mln
-24.5 mln
-55.81%
jan 1, 2002
21.4 mln
+2.0 mln
10.31%
jan 1, 2003
41.6 mln
+20.2 mln
94.39%
jan 1, 2004
32.0 mln
-9.6 mln
-23.08%
jan 1, 2005
32.0 mln
0.0
0.0%
jan 1, 2006
13.92 mln
-18.08 mln
-56.5%
jan 1, 2007
19.73 mln
+5.81 mln
41.74%
jan 1, 2008
35.239 mln
+15.509 mln
78.61%
jan 1, 2009
29.536 mln
-5.703 mln
-16.18%
jan 1, 2010
5.464 mln
-24.072 mln
-81.5%
jan 1, 2011
8.367 mln
+2.903 mln
53.13%
jan 1, 2012
11.127 mln
+2.76 mln
32.98%
jan 1, 2013
10.092 mln
-1.035 mln
-9.3%
jan 1, 2014
5.309 mln
-4.783 mln
-47.39%
jan 1, 2015
5.944 mln
+634.72K
11.96%
jan 1, 2016
8.269 mln
+2.325 mln
39.12%
Ranking of countries by current statistics by years


Comments: