29
/
en
AIzaSyAYiBZKx7MnpbEhh9jyipgxe19OcubqV5w
April 1, 2024
269975
Turkey
TUR
true
2
1
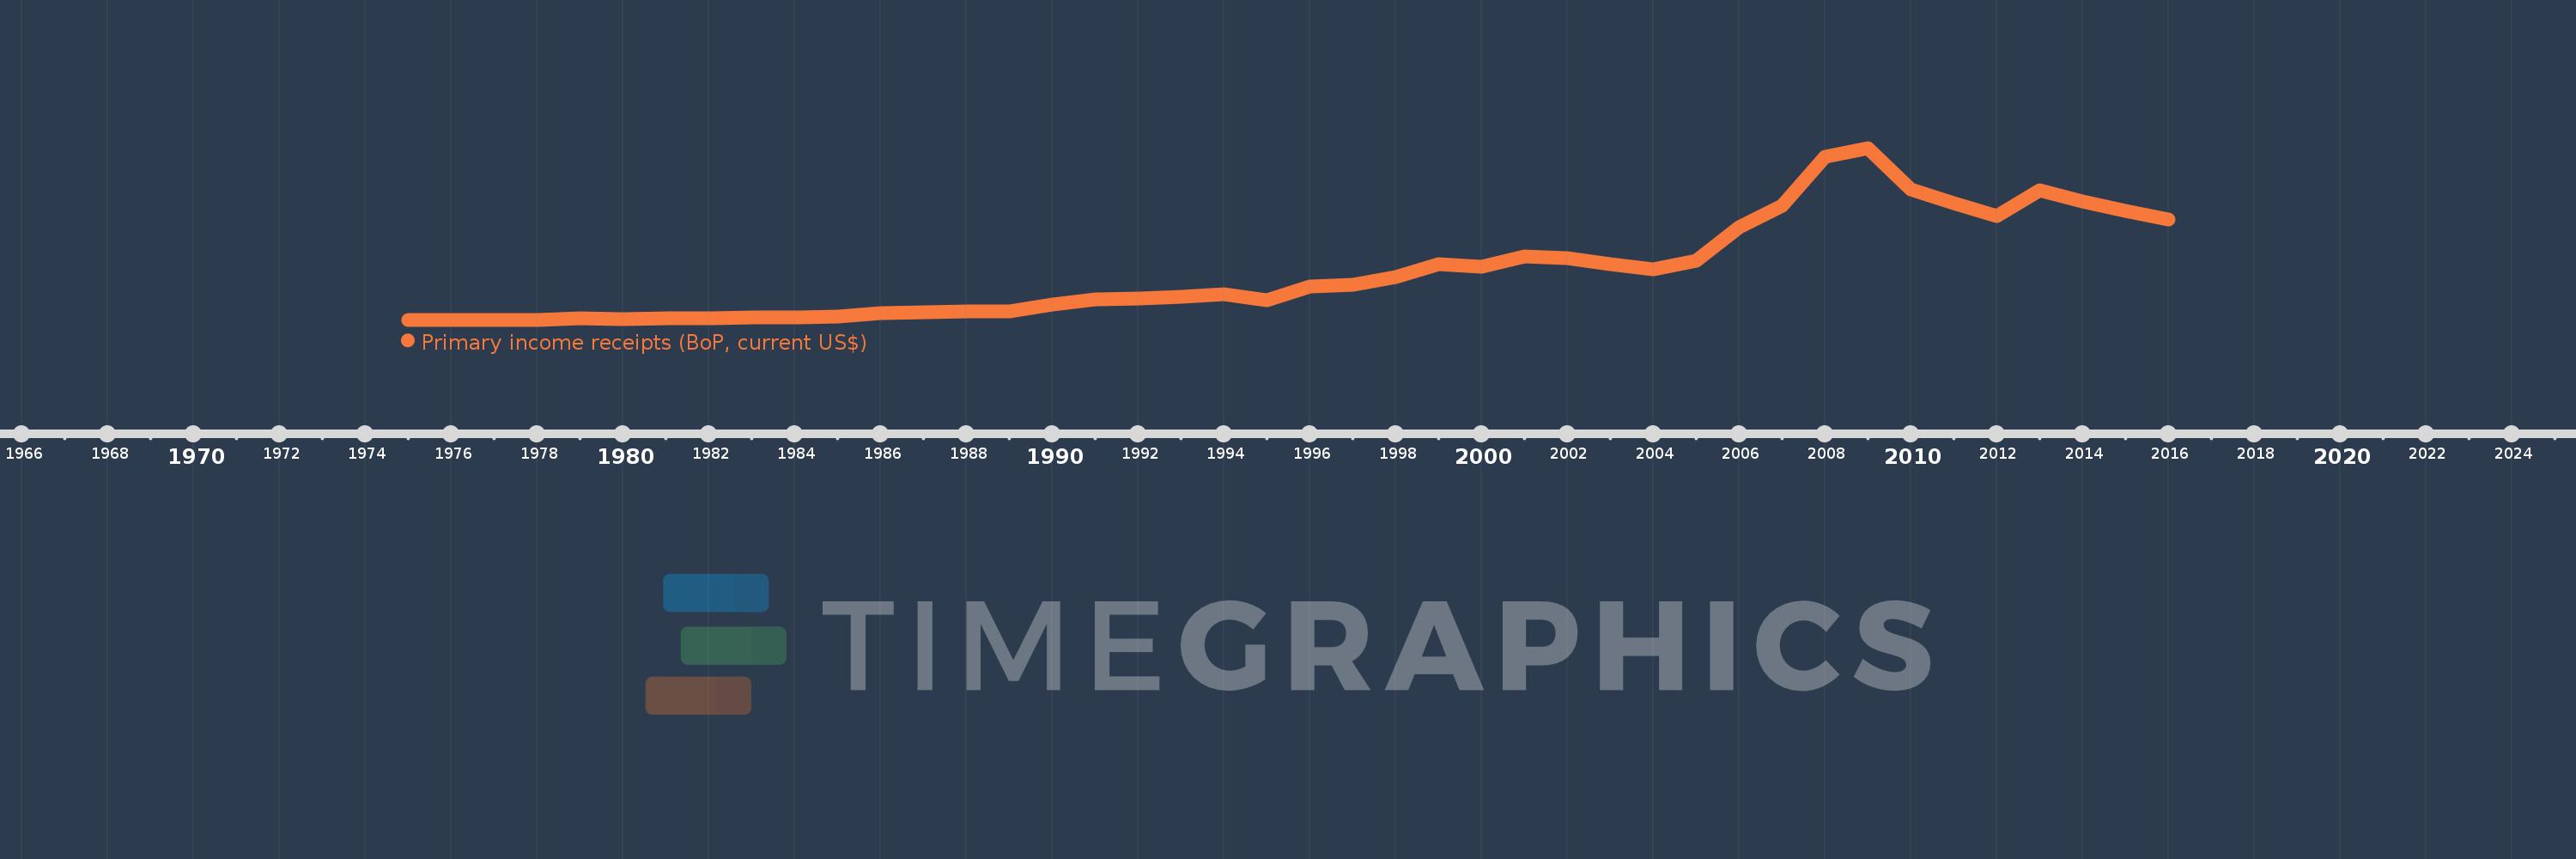
Primary income receipts (BoP, current US$)
2016,2015,2014,2013,2012,2011,2010,2009,2008,2007,2006,2005,2004,2003,2002,2001,2000,1999,1998,1997,1996,1995,1994,1993,1992,1991,1990,1989,1988,1987,1986,1985,1984,1983,1982,1981,1980,1979,1978,1977,1976,1975
This statistics in other country:
AfghanistanAlbaniaAlgeriaAngolaAntigua and BarbudaArab WorldArgentinaArmeniaArubaAustraliaAustriaAzerbaijanBahamas, TheBahrainBangladeshBarbadosBelarusBelgiumBelizeBeninBermudaBhutanBoliviaBosnia and HerzegovinaBotswanaBrazilBrunei DarussalamBulgariaBurkina FasoBurundiCabo VerdeCambodiaCameroonCanadaCaribbean small statesCentral African RepublicCentral Europe and the BalticsChadChileChinaColombiaComorosCongo, Dem. Rep.Congo, Rep.Costa RicaCote d'IvoireCroatiaCuracaoCyprusCzech RepublicDenmarkDjiboutiDominicaDominican RepublicEarly-demographic dividendEast Asia & PacificEast Asia & Pacific (excluding high income)East Asia & Pacific (IDA & IBRD countries)EcuadorEgypt, Arab Rep.El SalvadorEquatorial GuineaEritreaEstoniaEthiopiaEuro areaEurope & Central AsiaEurope & Central Asia (excluding high income)Europe & Central Asia (IDA & IBRD countries)European UnionFaroe IslandsFijiFinlandFragile and conflict affected situationsFranceFrench PolynesiaGabonGambia, TheGeorgiaGermanyGhanaGreeceGrenadaGuatemalaGuineaGuinea-BissauGuyanaHaitiHeavily indebted poor countries (HIPC)High incomeHondurasHong Kong SAR, ChinaHungaryIBRD onlyIcelandIDA & IBRD totalIDA blendIDA onlyIDA totalIndiaIndonesiaIran, Islamic Rep.IraqIrelandIsraelItalyJamaicaJapanJordanKazakhstanKenyaKiribatiKorea, Rep.KosovoKuwaitKyrgyz RepublicLao PDRLate-demographic dividendLatin America & Caribbean Latin America & Caribbean (excluding high income)Latin America & the Caribbean (IDA & IBRD countries)LatviaLeast developed countries: UN classificationLebanonLesothoLiberiaLibyaLithuaniaLow & middle incomeLow incomeLower middle incomeLuxembourgMacao SAR, ChinaMacedonia, FYRMadagascarMalawiMalaysiaMaldivesMaliMaltaMarshall IslandsMauritaniaMauritiusMexicoMicronesia, Fed. Sts.Middle East & North AfricaMiddle East & North Africa (excluding high income)Middle East & North Africa (IDA & IBRD countries)Middle incomeMoldovaMongoliaMontenegroMoroccoMozambiqueMyanmarNamibiaNepalNetherlandsNew CaledoniaNew ZealandNicaraguaNigerNigeriaNorth AmericaNorwayOECD membersOmanOther small statesPacific island small statesPakistanPalauPanamaPapua New GuineaParaguayPeruPhilippinesPolandPortugalPost-demographic dividendPre-demographic dividendQatarRomaniaRussian FederationRwandaSamoaSao Tome and PrincipeSaudi ArabiaSenegalSerbiaSeychellesSierra LeoneSingaporeSint Maarten (Dutch part)Slovak RepublicSloveniaSmall statesSolomon IslandsSouth AfricaSouth AsiaSouth Asia (IDA & IBRD)South SudanSpainSri LankaSt. Kitts and NevisSt. LuciaSt. Vincent and the GrenadinesSub-Saharan Africa Sub-Saharan Africa (excluding high income)Sub-Saharan Africa (IDA & IBRD countries)SudanSurinameSwazilandSwedenSwitzerlandSyrian Arab RepublicTajikistanTanzaniaThailandTimor-LesteTogoTongaTrinidad and TobagoTunisiaTurkeyTuvaluUgandaUkraineUnited KingdomUnited StatesUpper middle incomeUruguayVanuatuVenezuela, RBVietnamWest Bank and GazaWorldYemen, Rep.ZambiaZimbabwe Timeline:
This timeline shows a graph from 1975 to 2016 of Turkey. No data until 1974. Number of actual observations by date: 42.
Source name:
World Development Indicators
Source organization:
International Monetary Fund, Balance of Payments Statistics Yearbook and data files.
Categories, topics:
Economy & Growth
Last updated:
apr 23, 2017
Indicators value changes by year
Minimum:
1000.0K
jan 1, 1975
Maximum:
7.67 bln
jan 1, 2009
At the date of observation
Value
Absolute change
Change from previous value
jan 1, 1975
1000.0K
+1000.0K
0.0%
jan 1, 1976
1000.0K
0.0
0.0%
jan 1, 1977
1000.0K
0.0
0.0%
jan 1, 1978
6.0 mln
+5.0 mln
500.0%
jan 1, 1979
66.0 mln
+60.0 mln
1000.0%
jan 1, 1980
34.0 mln
-32.0 mln
-48.48%
jan 1, 1981
51.0 mln
+17.0 mln
50.0%
jan 1, 1982
52.0 mln
+1000.0K
1.96%
jan 1, 1983
120.0 mln
+68.0 mln
130.77%
jan 1, 1984
102.0 mln
-18.0 mln
-15.0%
jan 1, 1985
146.0 mln
+44.0 mln
43.14%
jan 1, 1986
298.0 mln
+152.0 mln
104.11%
jan 1, 1987
341.0 mln
+43.0 mln
14.43%
jan 1, 1988
382.0 mln
+41.0 mln
12.02%
jan 1, 1989
374.0 mln
-8.0 mln
-2.09%
jan 1, 1990
684.0 mln
+310.0 mln
82.89%
jan 1, 1991
917.0 mln
+233.0 mln
34.06%
jan 1, 1992
935.0 mln
+18.0 mln
1.96%
jan 1, 1993
1.012 bln
+77.0 mln
8.24%
jan 1, 1994
1.135 bln
+123.0 mln
12.15%
jan 1, 1995
890.0 mln
-245.0 mln
-21.59%
jan 1, 1996
1.489 bln
+599.0 mln
67.3%
jan 1, 1997
1.577 bln
+88.0 mln
5.91%
jan 1, 1998
1.9 bln
+323.0 mln
20.48%
jan 1, 1999
2.481 bln
+581.0 mln
30.58%
jan 1, 2000
2.35 bln
-131.0 mln
-5.28%
jan 1, 2001
2.836 bln
+486.0 mln
20.68%
jan 1, 2002
2.753 bln
-83.0 mln
-2.93%
jan 1, 2003
2.486 bln
-267.0 mln
-9.7%
jan 1, 2004
2.246 bln
-240.0 mln
-9.65%
jan 1, 2005
2.651 bln
+405.0 mln
18.03%
jan 1, 2006
4.125 bln
+1.474 bln
55.6%
jan 1, 2007
5.105 bln
+980.0 mln
23.76%
jan 1, 2008
7.271 bln
+2.166 bln
42.43%
jan 1, 2009
7.67 bln
+399.0 mln
5.49%
jan 1, 2010
5.833 bln
-1.837 bln
-23.95%
jan 1, 2011
5.197 bln
-636.0 mln
-10.9%
jan 1, 2012
4.625 bln
-572.0 mln
-11.01%
jan 1, 2013
5.762 bln
+1.137 bln
24.58%
jan 1, 2014
5.289 bln
-473.0 mln
-8.21%
jan 1, 2015
4.874 bln
-415.0 mln
-7.85%
jan 1, 2016
4.471 bln
-403.0 mln
-8.27%
Ranking of countries by current statistics by years


Comments: