29
/
en
AIzaSyAYiBZKx7MnpbEhh9jyipgxe19OcubqV5w
April 1, 2024
25265
Caribbean small states
CSS
false
2
1
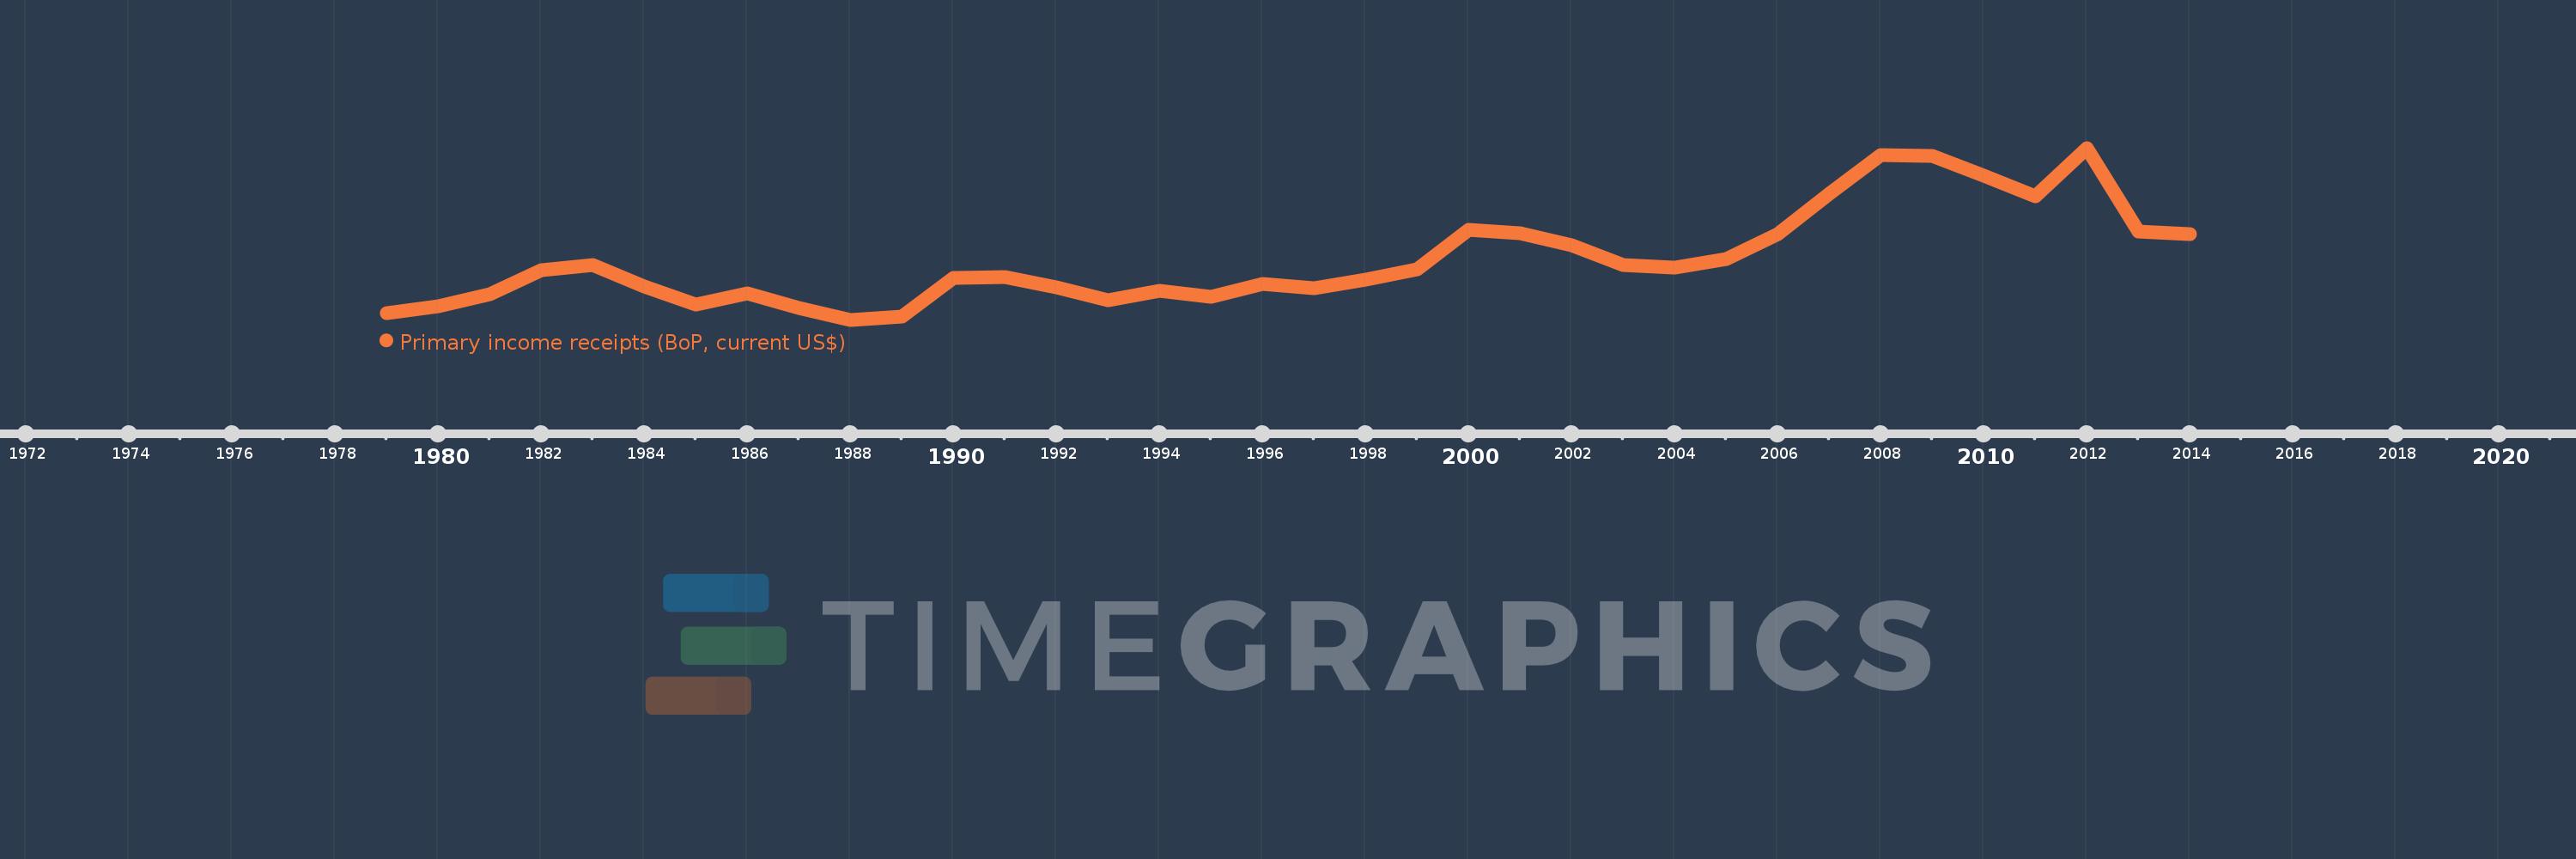
Primary income receipts (BoP, current US$)
2014,2013,2012,2011,2010,2009,2008,2007,2006,2005,2004,2003,2002,2001,2000,1999,1998,1997,1996,1995,1994,1993,1992,1991,1990,1989,1988,1987,1986,1985,1984,1983,1982,1981,1980,1979
This statistics in other country:
AfghanistanAlbaniaAlgeriaAngolaAntigua and BarbudaArab WorldArgentinaArmeniaArubaAustraliaAustriaAzerbaijanBahamas, TheBahrainBangladeshBarbadosBelarusBelgiumBelizeBeninBermudaBhutanBoliviaBosnia and HerzegovinaBotswanaBrazilBrunei DarussalamBulgariaBurkina FasoBurundiCabo VerdeCambodiaCameroonCanadaCaribbean small statesCentral African RepublicCentral Europe and the BalticsChadChileChinaColombiaComorosCongo, Dem. Rep.Congo, Rep.Costa RicaCote d'IvoireCroatiaCuracaoCyprusCzech RepublicDenmarkDjiboutiDominicaDominican RepublicEarly-demographic dividendEast Asia & PacificEast Asia & Pacific (excluding high income)East Asia & Pacific (IDA & IBRD countries)EcuadorEgypt, Arab Rep.El SalvadorEquatorial GuineaEritreaEstoniaEthiopiaEuro areaEurope & Central AsiaEurope & Central Asia (excluding high income)Europe & Central Asia (IDA & IBRD countries)European UnionFaroe IslandsFijiFinlandFragile and conflict affected situationsFranceFrench PolynesiaGabonGambia, TheGeorgiaGermanyGhanaGreeceGrenadaGuatemalaGuineaGuinea-BissauGuyanaHaitiHeavily indebted poor countries (HIPC)High incomeHondurasHong Kong SAR, ChinaHungaryIBRD onlyIcelandIDA & IBRD totalIDA blendIDA onlyIDA totalIndiaIndonesiaIran, Islamic Rep.IraqIrelandIsraelItalyJamaicaJapanJordanKazakhstanKenyaKiribatiKorea, Rep.KosovoKuwaitKyrgyz RepublicLao PDRLate-demographic dividendLatin America & Caribbean Latin America & Caribbean (excluding high income)Latin America & the Caribbean (IDA & IBRD countries)LatviaLeast developed countries: UN classificationLebanonLesothoLiberiaLibyaLithuaniaLow & middle incomeLow incomeLower middle incomeLuxembourgMacao SAR, ChinaMacedonia, FYRMadagascarMalawiMalaysiaMaldivesMaliMaltaMarshall IslandsMauritaniaMauritiusMexicoMicronesia, Fed. Sts.Middle East & North AfricaMiddle East & North Africa (excluding high income)Middle East & North Africa (IDA & IBRD countries)Middle incomeMoldovaMongoliaMontenegroMoroccoMozambiqueMyanmarNamibiaNepalNetherlandsNew CaledoniaNew ZealandNicaraguaNigerNigeriaNorth AmericaNorwayOECD membersOmanOther small statesPacific island small statesPakistanPalauPanamaPapua New GuineaParaguayPeruPhilippinesPolandPortugalPost-demographic dividendPre-demographic dividendQatarRomaniaRussian FederationRwandaSamoaSao Tome and PrincipeSaudi ArabiaSenegalSerbiaSeychellesSierra LeoneSingaporeSint Maarten (Dutch part)Slovak RepublicSloveniaSmall statesSolomon IslandsSouth AfricaSouth AsiaSouth Asia (IDA & IBRD)South SudanSpainSri LankaSt. Kitts and NevisSt. LuciaSt. Vincent and the GrenadinesSub-Saharan Africa Sub-Saharan Africa (excluding high income)Sub-Saharan Africa (IDA & IBRD countries)SudanSurinameSwazilandSwedenSwitzerlandSyrian Arab RepublicTajikistanTanzaniaThailandTimor-LesteTogoTongaTrinidad and TobagoTunisiaTurkeyTuvaluUgandaUkraineUnited KingdomUnited StatesUpper middle incomeUruguayVanuatuVenezuela, RBVietnamWest Bank and GazaWorldYemen, Rep.ZambiaZimbabwe Timeline:
This timeline shows a graph from 1979 to 2014 of Caribbean small states. No data until 1978. Number of actual observations by date: 36.
Source name:
World Development Indicators
Source organization:
International Monetary Fund, Balance of Payments Statistics Yearbook and data files.
Categories, topics:
Economy & Growth
Last updated:
apr 23, 2017
Indicators value changes by year
Minimum:
161.556 mln
jan 1, 1988
Maximum:
1.295 bln
jan 1, 2012
At the date of observation
Value
Absolute change
Change from previous value
jan 1, 1979
204.908 mln
+204.908 mln
0.0%
jan 1, 1980
251.761 mln
+46.853 mln
22.87%
jan 1, 1981
332.274 mln
+80.513 mln
31.98%
jan 1, 1982
491.266 mln
+158.992 mln
47.85%
jan 1, 1983
523.383 mln
+32.117 mln
6.54%
jan 1, 1984
382.681 mln
-140.702 mln
-26.88%
jan 1, 1985
263.261 mln
-119.42 mln
-31.21%
jan 1, 1986
337.789 mln
+74.528 mln
28.31%
jan 1, 1987
241.133 mln
-96.655 mln
-28.61%
jan 1, 1988
161.556 mln
-79.578 mln
-33.0%
jan 1, 1989
184.532 mln
+22.976 mln
14.22%
jan 1, 1990
437.806 mln
+253.275 mln
137.25%
jan 1, 1991
442.866 mln
+5.06 mln
1.16%
jan 1, 1992
373.382 mln
-69.484 mln
-15.69%
jan 1, 1993
290.26 mln
-83.122 mln
-22.26%
jan 1, 1994
349.846 mln
+59.586 mln
20.53%
jan 1, 1995
315.063 mln
-34.783 mln
-9.94%
jan 1, 1996
400.51 mln
+85.447 mln
27.12%
jan 1, 1997
370.091 mln
-30.419 mln
-7.59%
jan 1, 1998
428.782 mln
+58.691 mln
15.86%
jan 1, 1999
495.451 mln
+66.669 mln
15.55%
jan 1, 2000
755.711 mln
+260.261 mln
52.53%
jan 1, 2001
731.236 mln
-24.475 mln
-3.24%
jan 1, 2002
652.852 mln
-78.384 mln
-10.72%
jan 1, 2003
520.648 mln
-132.204 mln
-20.25%
jan 1, 2004
506.824 mln
-13.824 mln
-2.66%
jan 1, 2005
561.751 mln
+54.928 mln
10.84%
jan 1, 2006
725.15 mln
+163.398 mln
29.09%
jan 1, 2007
993.296 mln
+268.146 mln
36.98%
jan 1, 2008
1.249 bln
+256.041 mln
25.78%
jan 1, 2009
1.24 bln
-9.211 mln
-0.74%
jan 1, 2010
1.11 bln
-130.578 mln
-10.53%
jan 1, 2011
973.836 mln
-135.712 mln
-12.23%
jan 1, 2012
1.295 bln
+321.327 mln
33.0%
jan 1, 2013
744.756 mln
-550.407 mln
-42.5%
jan 1, 2014
729.252 mln
-15.504 mln
-2.08%
Ranking of countries by current statistics by years


Comments: