29
/
en
AIzaSyAYiBZKx7MnpbEhh9jyipgxe19OcubqV5w
April 1, 2024
145014
Guatemala
GTM
true
2
1
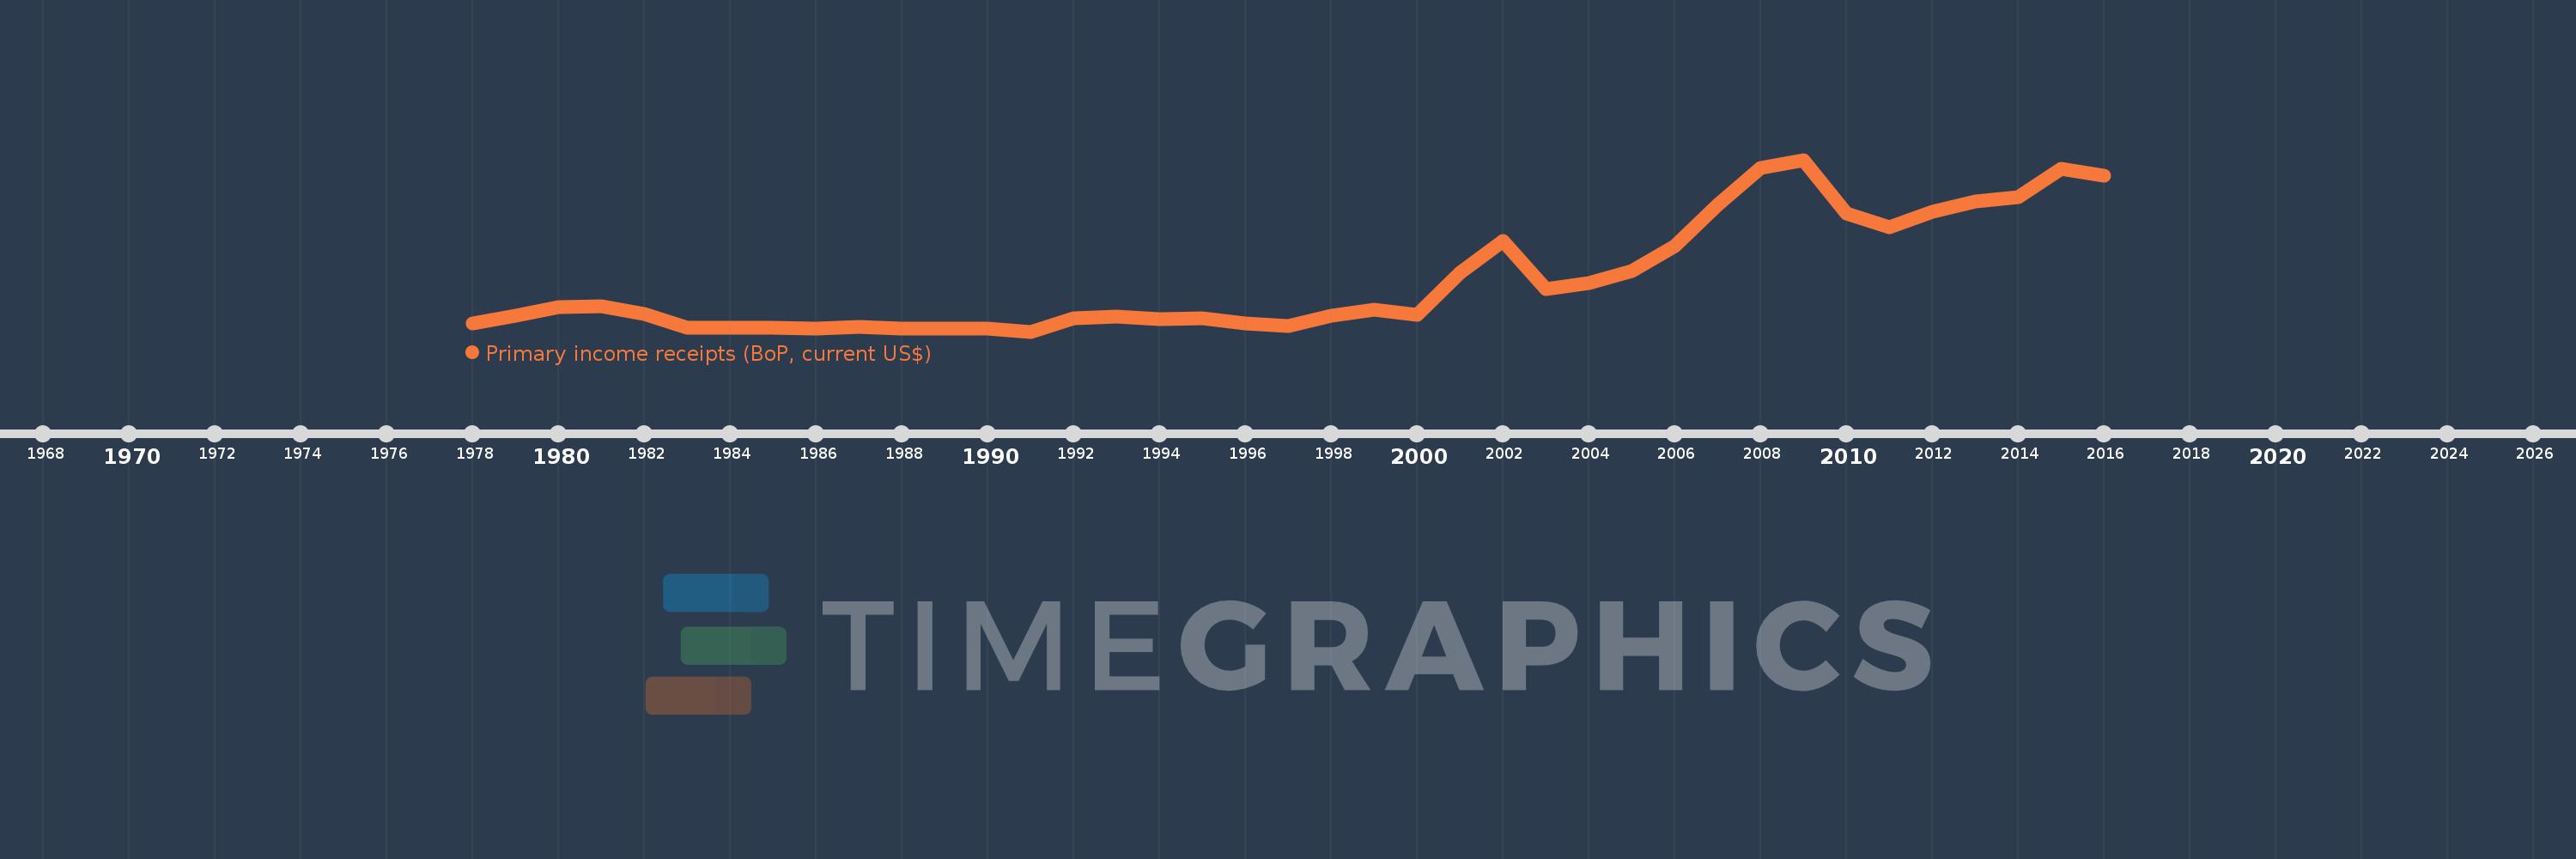
Primary income receipts (BoP, current US$)
2016,2015,2014,2013,2012,2011,2010,2009,2008,2007,2006,2005,2004,2003,2002,2001,2000,1999,1998,1997,1996,1995,1994,1993,1992,1991,1990,1989,1988,1987,1986,1985,1984,1983,1982,1981,1980,1979,1978
This statistics in other country:
AfghanistanAlbaniaAlgeriaAngolaAntigua and BarbudaArab WorldArgentinaArmeniaArubaAustraliaAustriaAzerbaijanBahamas, TheBahrainBangladeshBarbadosBelarusBelgiumBelizeBeninBermudaBhutanBoliviaBosnia and HerzegovinaBotswanaBrazilBrunei DarussalamBulgariaBurkina FasoBurundiCabo VerdeCambodiaCameroonCanadaCaribbean small statesCentral African RepublicCentral Europe and the BalticsChadChileChinaColombiaComorosCongo, Dem. Rep.Congo, Rep.Costa RicaCote d'IvoireCroatiaCuracaoCyprusCzech RepublicDenmarkDjiboutiDominicaDominican RepublicEarly-demographic dividendEast Asia & PacificEast Asia & Pacific (excluding high income)East Asia & Pacific (IDA & IBRD countries)EcuadorEgypt, Arab Rep.El SalvadorEquatorial GuineaEritreaEstoniaEthiopiaEuro areaEurope & Central AsiaEurope & Central Asia (excluding high income)Europe & Central Asia (IDA & IBRD countries)European UnionFaroe IslandsFijiFinlandFragile and conflict affected situationsFranceFrench PolynesiaGabonGambia, TheGeorgiaGermanyGhanaGreeceGrenadaGuatemalaGuineaGuinea-BissauGuyanaHaitiHeavily indebted poor countries (HIPC)High incomeHondurasHong Kong SAR, ChinaHungaryIBRD onlyIcelandIDA & IBRD totalIDA blendIDA onlyIDA totalIndiaIndonesiaIran, Islamic Rep.IraqIrelandIsraelItalyJamaicaJapanJordanKazakhstanKenyaKiribatiKorea, Rep.KosovoKuwaitKyrgyz RepublicLao PDRLate-demographic dividendLatin America & Caribbean Latin America & Caribbean (excluding high income)Latin America & the Caribbean (IDA & IBRD countries)LatviaLeast developed countries: UN classificationLebanonLesothoLiberiaLibyaLithuaniaLow & middle incomeLow incomeLower middle incomeLuxembourgMacao SAR, ChinaMacedonia, FYRMadagascarMalawiMalaysiaMaldivesMaliMaltaMarshall IslandsMauritaniaMauritiusMexicoMicronesia, Fed. Sts.Middle East & North AfricaMiddle East & North Africa (excluding high income)Middle East & North Africa (IDA & IBRD countries)Middle incomeMoldovaMongoliaMontenegroMoroccoMozambiqueMyanmarNamibiaNepalNetherlandsNew CaledoniaNew ZealandNicaraguaNigerNigeriaNorth AmericaNorwayOECD membersOmanOther small statesPacific island small statesPakistanPalauPanamaPapua New GuineaParaguayPeruPhilippinesPolandPortugalPost-demographic dividendPre-demographic dividendQatarRomaniaRussian FederationRwandaSamoaSao Tome and PrincipeSaudi ArabiaSenegalSerbiaSeychellesSierra LeoneSingaporeSint Maarten (Dutch part)Slovak RepublicSloveniaSmall statesSolomon IslandsSouth AfricaSouth AsiaSouth Asia (IDA & IBRD)South SudanSpainSri LankaSt. Kitts and NevisSt. LuciaSt. Vincent and the GrenadinesSub-Saharan Africa Sub-Saharan Africa (excluding high income)Sub-Saharan Africa (IDA & IBRD countries)SudanSurinameSwazilandSwedenSwitzerlandSyrian Arab RepublicTajikistanTanzaniaThailandTimor-LesteTogoTongaTrinidad and TobagoTunisiaTurkeyTuvaluUgandaUkraineUnited KingdomUnited StatesUpper middle incomeUruguayVanuatuVenezuela, RBVietnamWest Bank and GazaWorldYemen, Rep.ZambiaZimbabwe Timeline:
This timeline shows a graph from 1978 to 2016 of Guatemala. No data until 1977. Number of actual observations by date: 39.
Source name:
World Development Indicators
Source organization:
International Monetary Fund, Balance of Payments Statistics Yearbook and data files.
Categories, topics:
Economy & Growth
Last updated:
apr 23, 2017
Indicators value changes by year
Minimum:
20.9 mln
jan 1, 1991
Maximum:
583.28 mln
jan 1, 2009
At the date of observation
Value
Absolute change
Change from previous value
jan 1, 1978
47.9 mln
+47.9 mln
0.0%
jan 1, 1979
72.9 mln
+25.0 mln
52.19%
jan 1, 1980
102.1 mln
+29.2 mln
40.05%
jan 1, 1981
103.0 mln
+900.0K
0.88%
jan 1, 1982
79.5 mln
-23.5 mln
-22.82%
jan 1, 1983
34.2 mln
-45.3 mln
-56.98%
jan 1, 1984
33.0 mln
-1.2 mln
-3.51%
jan 1, 1985
33.0 mln
0.0
0.0%
jan 1, 1986
30.5 mln
-2.5 mln
-7.58%
jan 1, 1987
35.7 mln
+5.2 mln
17.05%
jan 1, 1988
31.1 mln
-4.6 mln
-12.89%
jan 1, 1989
31.6 mln
+500.0K
1.61%
jan 1, 1990
31.0 mln
-600.0K
-1.9%
jan 1, 1991
20.9 mln
-10.1 mln
-32.58%
jan 1, 1992
63.9 mln
+43.0 mln
205.74%
jan 1, 1993
69.1 mln
+5.2 mln
8.14%
jan 1, 1994
61.1 mln
-8.0 mln
-11.58%
jan 1, 1995
63.6 mln
+2.5 mln
4.09%
jan 1, 1996
46.6 mln
-17.0 mln
-26.73%
jan 1, 1997
40.2 mln
-6.4 mln
-13.73%
jan 1, 1998
72.4 mln
+32.2 mln
80.1%
jan 1, 1999
91.4 mln
+19.0 mln
26.24%
jan 1, 2000
76.2 mln
-15.2 mln
-16.63%
jan 1, 2001
214.4 mln
+138.2 mln
181.36%
jan 1, 2002
317.455 mln
+103.055 mln
48.07%
jan 1, 2003
161.099 mln
-156.357 mln
-49.25%
jan 1, 2004
179.089 mln
+17.99 mln
11.17%
jan 1, 2005
219.9 mln
+40.811 mln
22.79%
jan 1, 2006
301.5 mln
+81.6 mln
37.11%
jan 1, 2007
434.6 mln
+133.1 mln
44.15%
jan 1, 2008
556.0 mln
+121.4 mln
27.93%
jan 1, 2009
583.28 mln
+27.28 mln
4.91%
jan 1, 2010
408.368 mln
-174.912 mln
-29.99%
jan 1, 2011
361.619 mln
-46.749 mln
-11.45%
jan 1, 2012
413.578 mln
+51.959 mln
14.37%
jan 1, 2013
447.016 mln
+33.438 mln
8.09%
jan 1, 2014
461.759 mln
+14.743 mln
3.3%
jan 1, 2015
554.092 mln
+92.333 mln
20.0%
jan 1, 2016
532.31 mln
-21.781 mln
-3.93%
Ranking of countries by current statistics by years


Comments: