29
/
en
AIzaSyAYiBZKx7MnpbEhh9jyipgxe19OcubqV5w
April 1, 2024
132570
Fiji
FJI
true
2
1
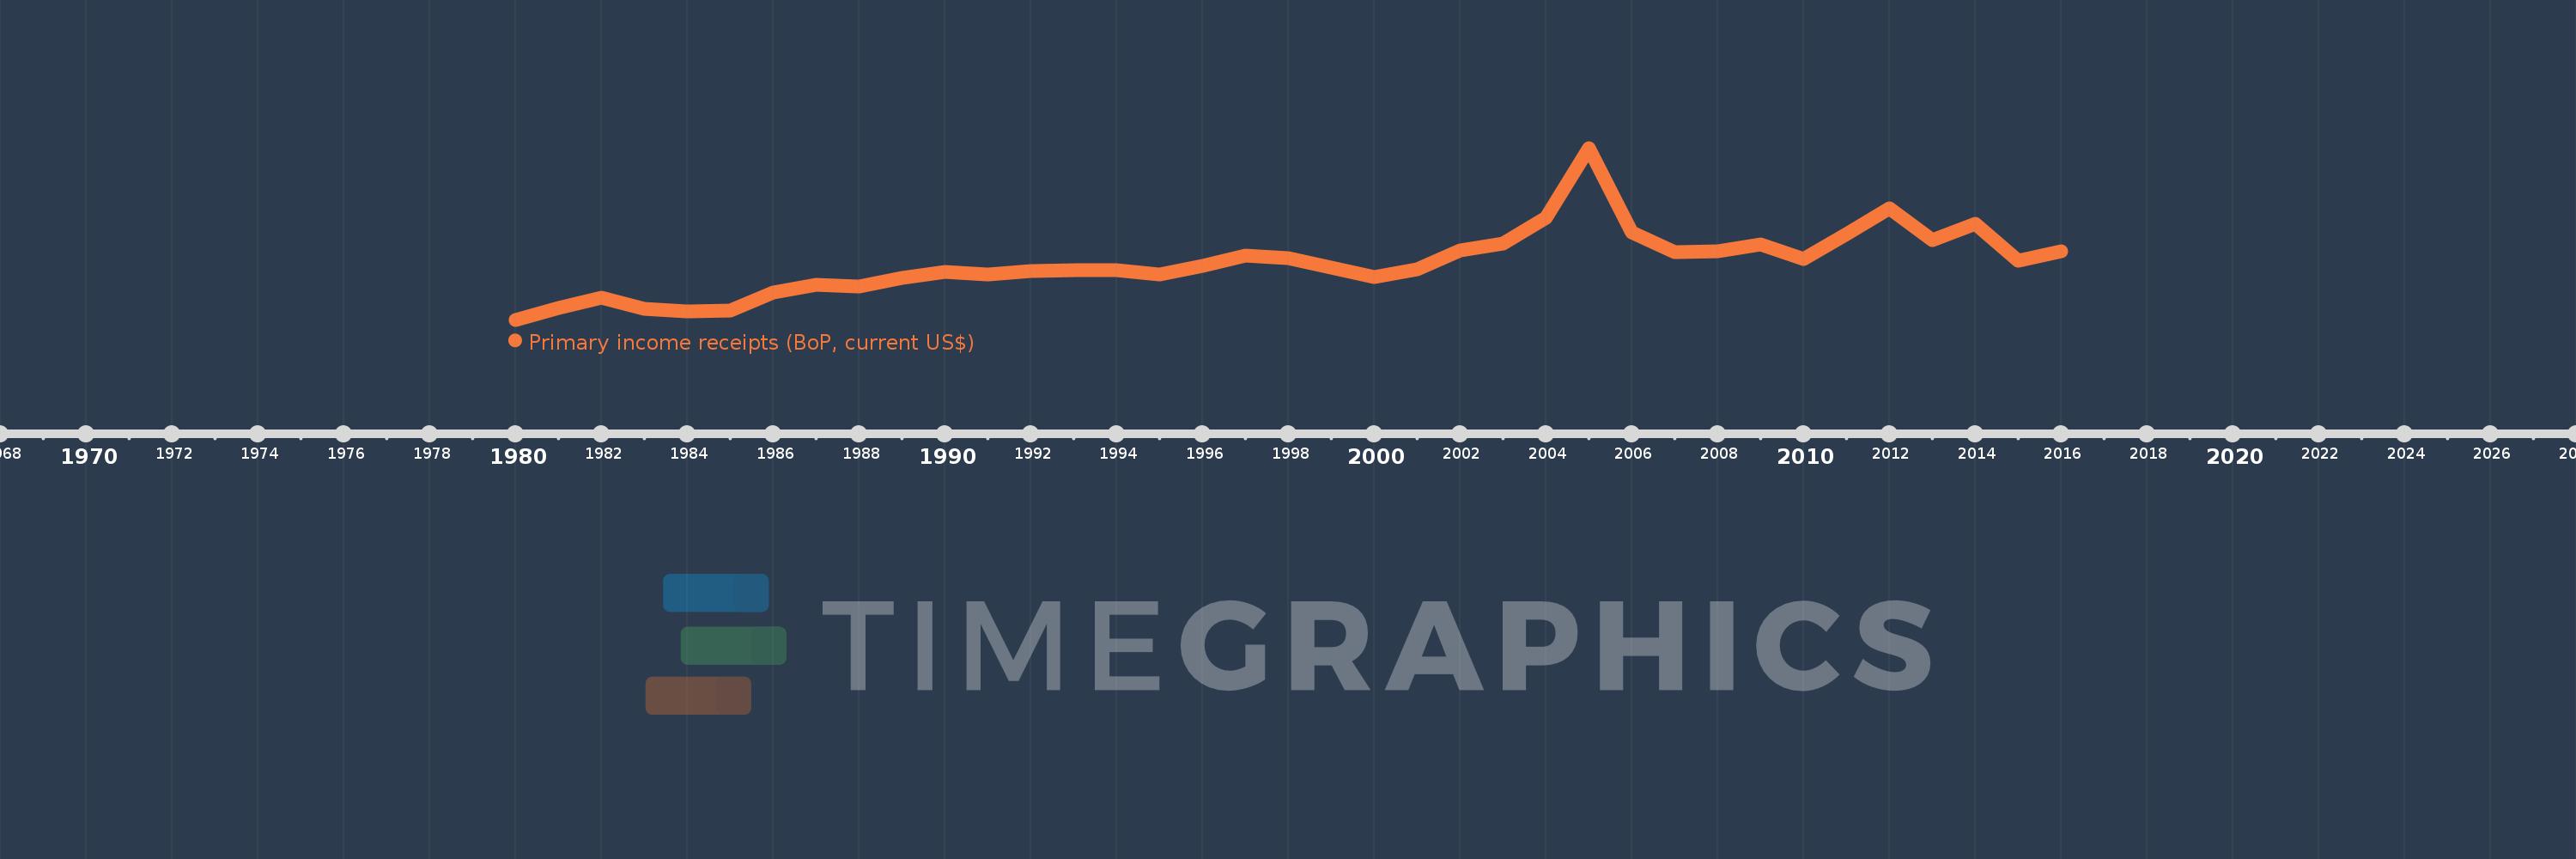
Primary income receipts (BoP, current US$)
2016,2015,2014,2013,2012,2011,2010,2009,2008,2007,2006,2005,2004,2003,2002,2001,2000,1999,1998,1997,1996,1995,1994,1993,1992,1991,1990,1989,1988,1987,1986,1985,1984,1983,1982,1981,1980
This statistics in other country:
AfghanistanAlbaniaAlgeriaAngolaAntigua and BarbudaArab WorldArgentinaArmeniaArubaAustraliaAustriaAzerbaijanBahamas, TheBahrainBangladeshBarbadosBelarusBelgiumBelizeBeninBermudaBhutanBoliviaBosnia and HerzegovinaBotswanaBrazilBrunei DarussalamBulgariaBurkina FasoBurundiCabo VerdeCambodiaCameroonCanadaCaribbean small statesCentral African RepublicCentral Europe and the BalticsChadChileChinaColombiaComorosCongo, Dem. Rep.Congo, Rep.Costa RicaCote d'IvoireCroatiaCuracaoCyprusCzech RepublicDenmarkDjiboutiDominicaDominican RepublicEarly-demographic dividendEast Asia & PacificEast Asia & Pacific (excluding high income)East Asia & Pacific (IDA & IBRD countries)EcuadorEgypt, Arab Rep.El SalvadorEquatorial GuineaEritreaEstoniaEthiopiaEuro areaEurope & Central AsiaEurope & Central Asia (excluding high income)Europe & Central Asia (IDA & IBRD countries)European UnionFaroe IslandsFijiFinlandFragile and conflict affected situationsFranceFrench PolynesiaGabonGambia, TheGeorgiaGermanyGhanaGreeceGrenadaGuatemalaGuineaGuinea-BissauGuyanaHaitiHeavily indebted poor countries (HIPC)High incomeHondurasHong Kong SAR, ChinaHungaryIBRD onlyIcelandIDA & IBRD totalIDA blendIDA onlyIDA totalIndiaIndonesiaIran, Islamic Rep.IraqIrelandIsraelItalyJamaicaJapanJordanKazakhstanKenyaKiribatiKorea, Rep.KosovoKuwaitKyrgyz RepublicLao PDRLate-demographic dividendLatin America & Caribbean Latin America & Caribbean (excluding high income)Latin America & the Caribbean (IDA & IBRD countries)LatviaLeast developed countries: UN classificationLebanonLesothoLiberiaLibyaLithuaniaLow & middle incomeLow incomeLower middle incomeLuxembourgMacao SAR, ChinaMacedonia, FYRMadagascarMalawiMalaysiaMaldivesMaliMaltaMarshall IslandsMauritaniaMauritiusMexicoMicronesia, Fed. Sts.Middle East & North AfricaMiddle East & North Africa (excluding high income)Middle East & North Africa (IDA & IBRD countries)Middle incomeMoldovaMongoliaMontenegroMoroccoMozambiqueMyanmarNamibiaNepalNetherlandsNew CaledoniaNew ZealandNicaraguaNigerNigeriaNorth AmericaNorwayOECD membersOmanOther small statesPacific island small statesPakistanPalauPanamaPapua New GuineaParaguayPeruPhilippinesPolandPortugalPost-demographic dividendPre-demographic dividendQatarRomaniaRussian FederationRwandaSamoaSao Tome and PrincipeSaudi ArabiaSenegalSerbiaSeychellesSierra LeoneSingaporeSint Maarten (Dutch part)Slovak RepublicSloveniaSmall statesSolomon IslandsSouth AfricaSouth AsiaSouth Asia (IDA & IBRD)South SudanSpainSri LankaSt. Kitts and NevisSt. LuciaSt. Vincent and the GrenadinesSub-Saharan Africa Sub-Saharan Africa (excluding high income)Sub-Saharan Africa (IDA & IBRD countries)SudanSurinameSwazilandSwedenSwitzerlandSyrian Arab RepublicTajikistanTanzaniaThailandTimor-LesteTogoTongaTrinidad and TobagoTunisiaTurkeyTuvaluUgandaUkraineUnited KingdomUnited StatesUpper middle incomeUruguayVanuatuVenezuela, RBVietnamWest Bank and GazaWorldYemen, Rep.ZambiaZimbabwe Timeline:
This timeline shows a graph from 1980 to 2016 of Fiji. No data until 1979. Number of actual observations by date: 37.
Source name:
World Development Indicators
Source organization:
International Monetary Fund, Balance of Payments Statistics Yearbook and data files.
Categories, topics:
Economy & Growth
Last updated:
apr 23, 2017
Indicators value changes by year
Minimum:
14.047 mln
jan 1, 1980
Maximum:
146.695 mln
jan 1, 2005
At the date of observation
Value
Absolute change
Change from previous value
jan 1, 1980
14.047 mln
+14.047 mln
0.0%
jan 1, 1981
23.008 mln
+8.961 mln
63.79%
jan 1, 1982
30.891 mln
+7.882 mln
34.26%
jan 1, 1983
22.489 mln
-8.402 mln
-27.2%
jan 1, 1984
20.649 mln
-1.841 mln
-8.18%
jan 1, 1985
20.94 mln
+291.839K
1.41%
jan 1, 1986
35.022 mln
+14.082 mln
67.25%
jan 1, 1987
41.223 mln
+6.201 mln
17.71%
jan 1, 1988
39.956 mln
-1.267 mln
-3.07%
jan 1, 1989
46.215 mln
+6.259 mln
15.66%
jan 1, 1990
51.236 mln
+5.021 mln
10.86%
jan 1, 1991
49.091 mln
-2.144 mln
-4.19%
jan 1, 1992
51.845 mln
+2.753 mln
5.61%
jan 1, 1993
52.296 mln
+450.917K
0.87%
jan 1, 1994
52.148 mln
-148.041K
-0.28%
jan 1, 1995
49.176 mln
-2.972 mln
-5.7%
jan 1, 1996
55.392 mln
+6.216 mln
12.64%
jan 1, 1997
63.636 mln
+8.243 mln
14.88%
jan 1, 1998
61.717 mln
-1.918 mln
-3.01%
jan 1, 1999
54.56 mln
-7.158 mln
-11.6%
jan 1, 2000
47.268 mln
-7.292 mln
-13.36%
jan 1, 2001
53.253 mln
+5.985 mln
12.66%
jan 1, 2002
67.414 mln
+14.161 mln
26.59%
jan 1, 2003
72.766 mln
+5.352 mln
7.94%
jan 1, 2004
92.999 mln
+20.233 mln
27.81%
jan 1, 2005
146.695 mln
+53.696 mln
57.74%
jan 1, 2006
81.593 mln
-65.102 mln
-44.38%
jan 1, 2007
66.008 mln
-15.585 mln
-19.1%
jan 1, 2008
67.098 mln
+1.09 mln
1.65%
jan 1, 2009
72.327 mln
+5.229 mln
7.79%
jan 1, 2010
61.213 mln
-11.114 mln
-15.37%
jan 1, 2011
80.291 mln
+19.078 mln
31.17%
jan 1, 2012
99.779 mln
+19.488 mln
24.27%
jan 1, 2013
75.519 mln
-24.261 mln
-24.31%
jan 1, 2014
88.132 mln
+12.613 mln
16.7%
jan 1, 2015
59.356 mln
-28.776 mln
-32.65%
jan 1, 2016
66.856 mln
+7.5 mln
12.64%
Ranking of countries by current statistics by years


Comments: