29
/
en
AIzaSyAYiBZKx7MnpbEhh9jyipgxe19OcubqV5w
April 1, 2024
71554
Armenia
ARM
true
2
1
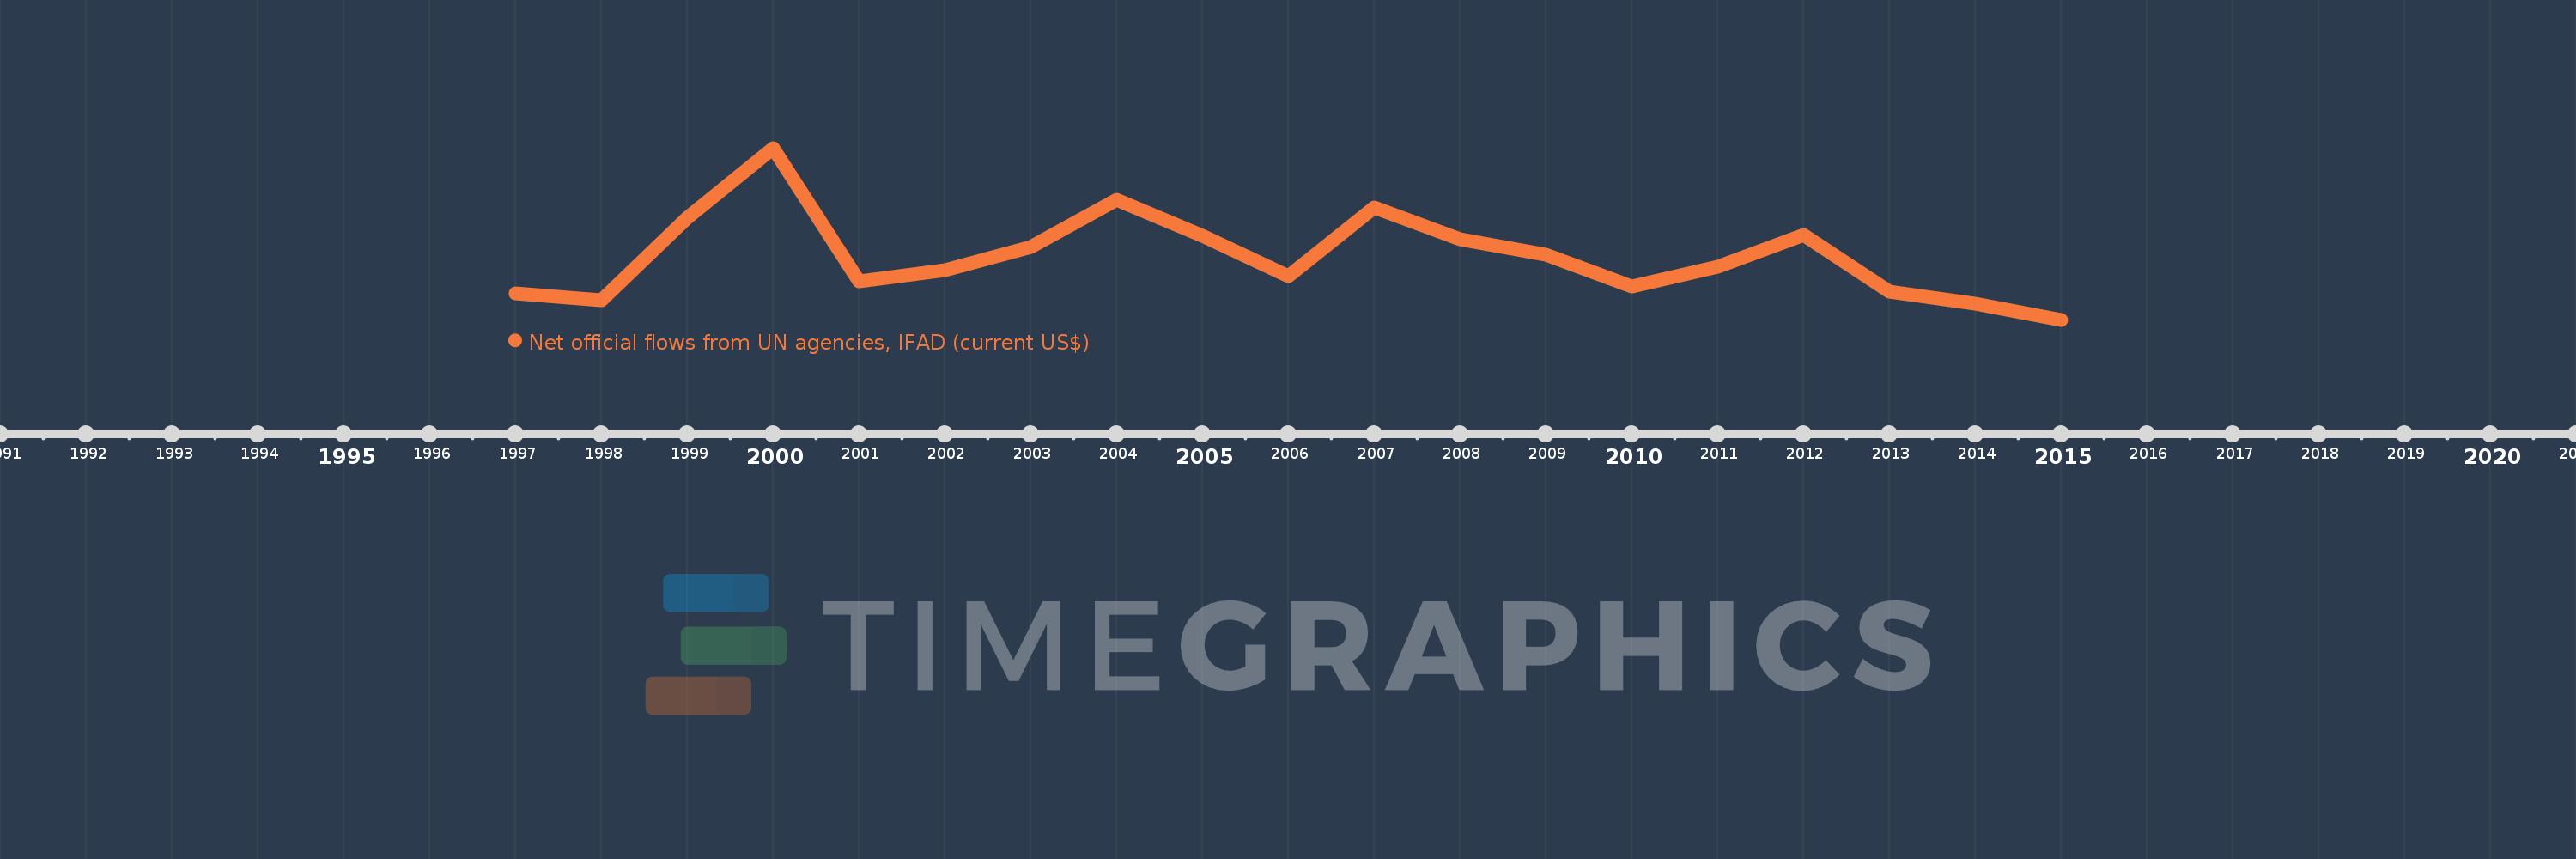
Net official flows from UN agencies, IFAD (current US$)
2015,2014,2013,2012,2011,2010,2009,2008,2007,2006,2005,2004,2003,2002,2001,2000,1999,1998,1997
This statistics in other country:
Timeline:
This timeline shows a graph from 1997 to 2015 of Armenia. No data until 1996. Number of actual observations by date: 19.
Source name:
World Development Indicators
Source organization:
Development Assistance Committee of the Organisation for Economic Co-operation and Development, Geographical Distribution of Financial Flows to Developing Countries, Development Co-operation Report, and International Development Statistics database. Data are available online at: www.oecd.org/dac/stats/idsonline.
Categories, topics:
Aid Effectiveness
Last updated:
apr 23, 2017
Indicators value changes by year
Minimum:
-580.0K
jan 1, 2015
Maximum:
10.09 mln
jan 1, 2000
At the date of observation
Value
Absolute change
Change from previous value
jan 1, 1997
1.05 mln
+1.05 mln
0.0%
jan 1, 1998
620.0K
-430.0K
-40.95%
jan 1, 1999
5.75 mln
+5.13 mln
827.42%
jan 1, 2000
10.09 mln
+4.34 mln
75.48%
jan 1, 2001
1.82 mln
-8.27 mln
-81.96%
jan 1, 2002
2.51 mln
+690.0K
37.91%
jan 1, 2003
3.93 mln
+1.42 mln
56.57%
jan 1, 2004
6.89 mln
+2.96 mln
75.32%
jan 1, 2005
4.62 mln
-2.27 mln
-32.95%
jan 1, 2006
2.1 mln
-2.52 mln
-54.55%
jan 1, 2007
6.41 mln
+4.31 mln
205.24%
jan 1, 2008
4.4 mln
-2.01 mln
-31.36%
jan 1, 2009
3.46 mln
-940.0K
-21.36%
jan 1, 2010
1.49 mln
-1.97 mln
-56.94%
jan 1, 2011
2.71 mln
+1.22 mln
81.88%
jan 1, 2012
4.71 mln
+2.0 mln
73.8%
jan 1, 2013
1.15 mln
-3.56 mln
-75.58%
jan 1, 2014
440.0K
-710.0K
-61.74%
jan 1, 2015
-580.0K
-1.02 mln
-231.82%
Ranking of countries by current statistics by years


Comments: