29
/
en
AIzaSyAYiBZKx7MnpbEhh9jyipgxe19OcubqV5w
April 1, 2024
54304
Pacific island small states
PSS
false
2
1
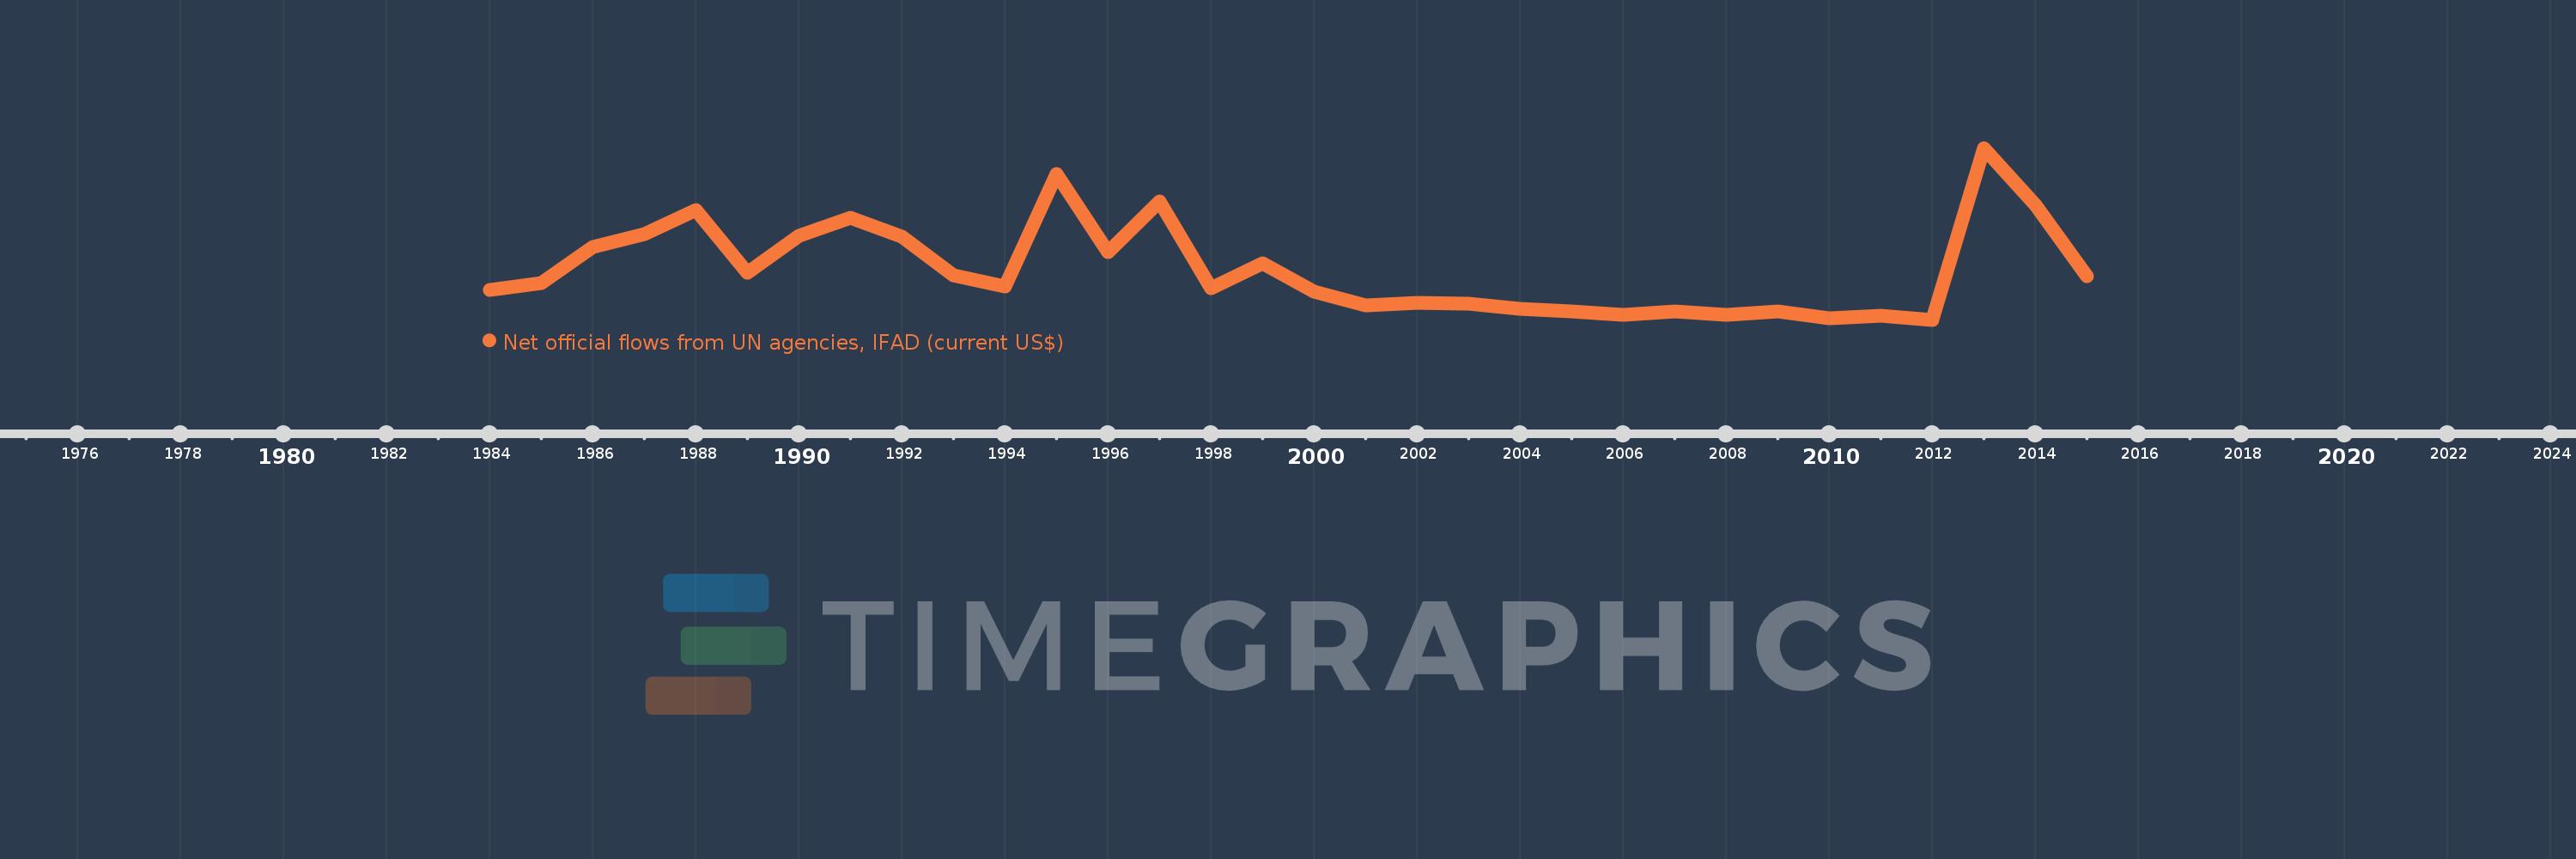
Net official flows from UN agencies, IFAD (current US$)
2015,2014,2013,2012,2011,2010,2009,2008,2007,2006,2005,2004,2003,2002,2001,2000,1999,1998,1997,1996,1995,1994,1993,1992,1991,1990,1989,1988,1987,1986,1985,1984
This statistics in other country:
Timeline:
This timeline shows a graph from 1984 to 2015 of Pacific island small states. No data until 1983. Number of actual observations by date: 32.
Source name:
World Development Indicators
Source organization:
Development Assistance Committee of the Organisation for Economic Co-operation and Development, Geographical Distribution of Financial Flows to Developing Countries, Development Co-operation Report, and International Development Statistics database. Data are available online at: www.oecd.org/dac/stats/idsonline.
Categories, topics:
Aid Effectiveness
Last updated:
apr 23, 2017
Indicators value changes by year
Minimum:
-380.0K
jan 1, 2012
Maximum:
2.38 mln
jan 1, 2013
At the date of observation
Value
Absolute change
Change from previous value
jan 1, 1984
100.0K
+100.0K
0.0%
jan 1, 1985
210.0K
+110.0K
110.0%
jan 1, 1986
790.0K
+580.0K
276.19%
jan 1, 1987
990.0K
+200.0K
25.32%
jan 1, 1988
1.38 mln
+390.0K
39.39%
jan 1, 1989
380.0K
-1000.0K
-72.46%
jan 1, 1990
970.0K
+590.0K
155.26%
jan 1, 1991
1.26 mln
+290.0K
29.9%
jan 1, 1992
950.0K
-310.0K
-24.6%
jan 1, 1993
330.0K
-620.0K
-65.26%
jan 1, 1994
150.0K
-180.0K
-54.55%
jan 1, 1995
1.96 mln
+1.81 mln
1.21K%
jan 1, 1996
710.0K
-1.25 mln
-63.78%
jan 1, 1997
1.52 mln
+810.0K
114.08%
jan 1, 1998
120.0K
-1.4 mln
-92.11%
jan 1, 1999
520.0K
+400.0K
333.33%
jan 1, 2000
70.0K
-450.0K
-86.54%
jan 1, 2001
-150.0K
-220.0K
-314.29%
jan 1, 2002
-110.0K
+40.0K
-26.67%
jan 1, 2003
-120.0K
-10.0K
9.09%
jan 1, 2004
-200.0K
-80.0K
66.67%
jan 1, 2005
-250.0K
-50.0K
25.0%
jan 1, 2006
-300.0K
-50.0K
20.0%
jan 1, 2007
-240.0K
+60.0K
-20.0%
jan 1, 2008
-300.0K
-60.0K
25.0%
jan 1, 2009
-250.0K
+50.0K
-16.67%
jan 1, 2010
-360.0K
-110.0K
44.0%
jan 1, 2011
-310.0K
+50.0K
-13.89%
jan 1, 2012
-380.0K
-70.0K
22.58%
jan 1, 2013
2.38 mln
+2.76 mln
-726.32%
jan 1, 2014
1.46 mln
-920.0K
-38.66%
jan 1, 2015
320.0K
-1.14 mln
-78.08%
Ranking of countries by current statistics by years


Comments: