29
/
en
AIzaSyAYiBZKx7MnpbEhh9jyipgxe19OcubqV5w
April 1, 2024
103973
Chad
TCD
true
2
1
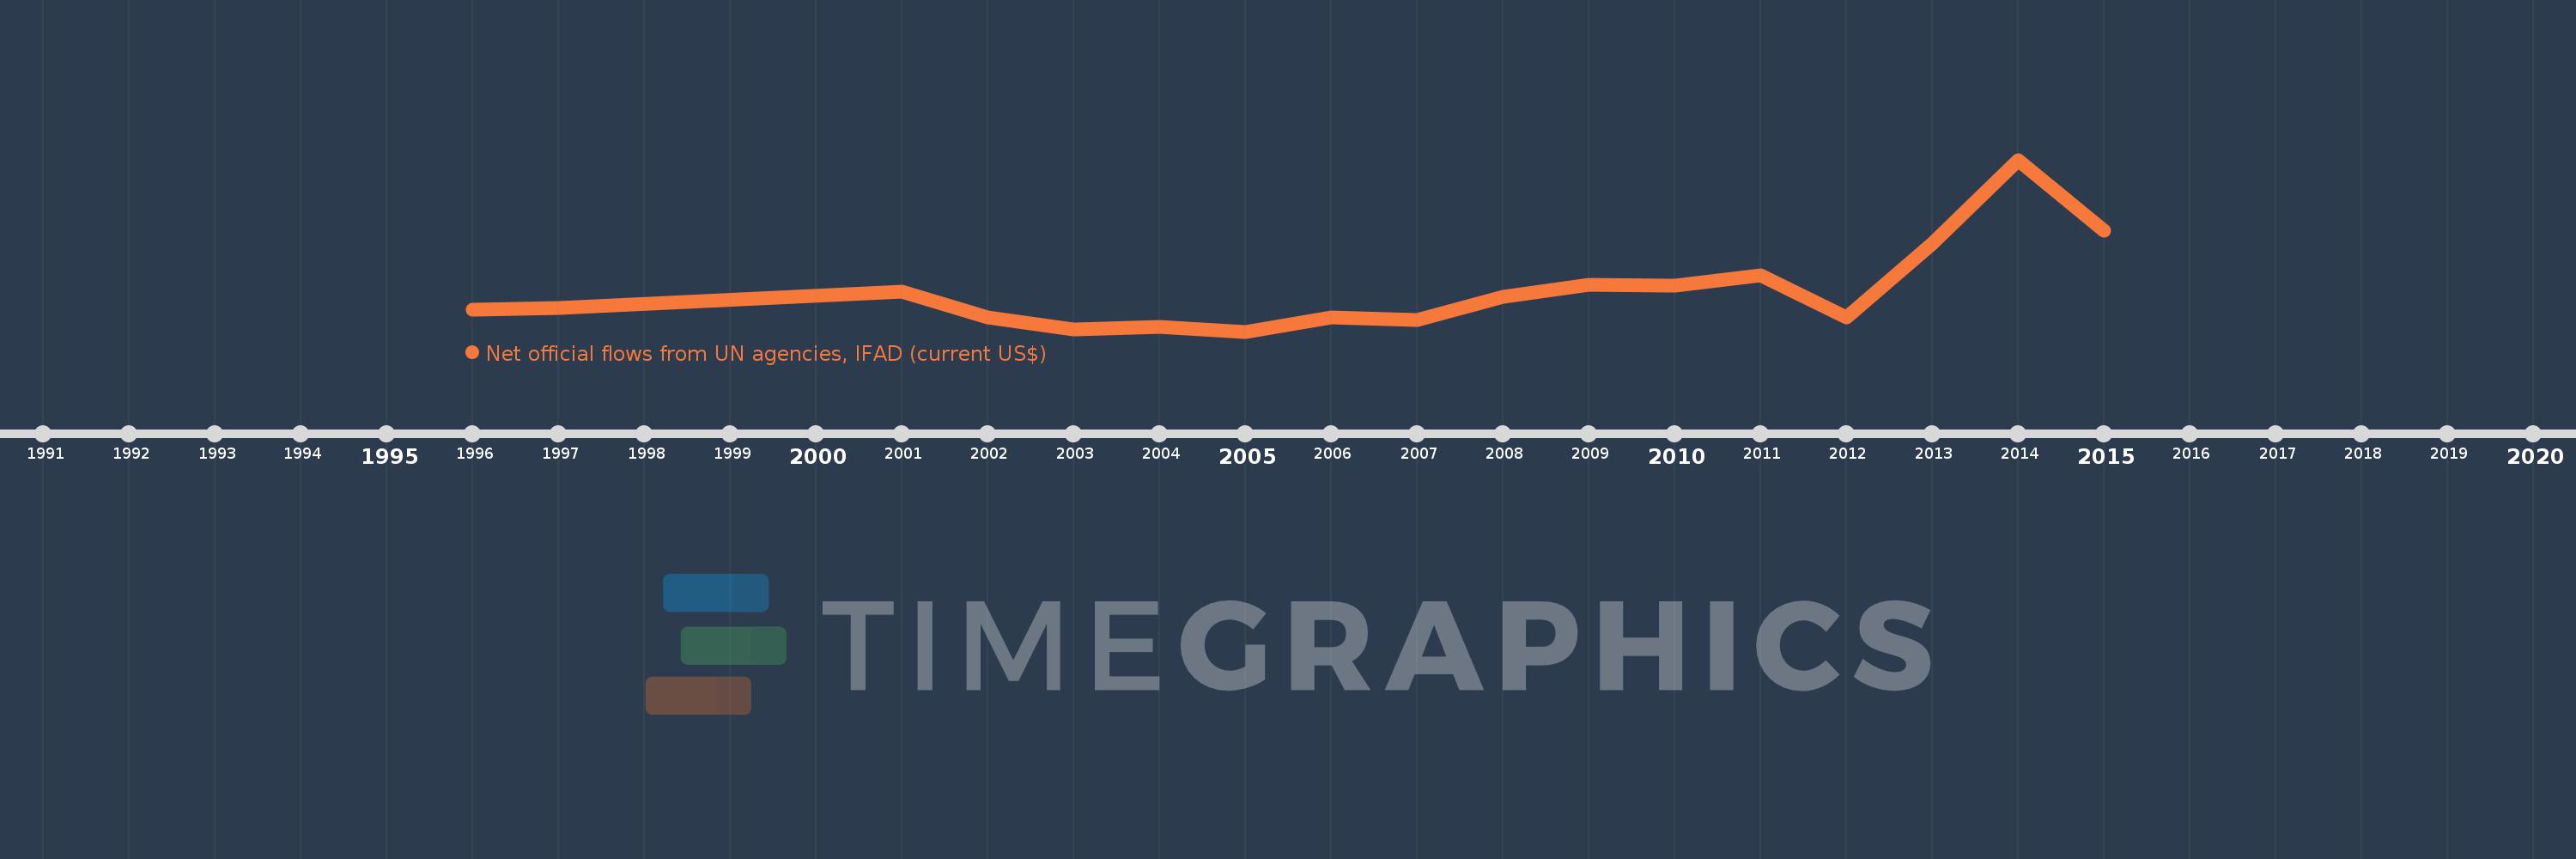
Net official flows from UN agencies, IFAD (current US$)
2015,2014,2013,2012,2011,2010,2009,2008,2007,2006,2005,2004,2003,2002,2001,1997,1996
This statistics in other country:
Timeline:
This timeline shows a graph from 1996 to 2015 of Chad. No data until 1995. Number of actual observations by date: 17.
Source name:
World Development Indicators
Source organization:
Development Assistance Committee of the Organisation for Economic Co-operation and Development, Geographical Distribution of Financial Flows to Developing Countries, Development Co-operation Report, and International Development Statistics database. Data are available online at: www.oecd.org/dac/stats/idsonline.
Categories, topics:
Aid Effectiveness
Last updated:
apr 23, 2017
Indicators value changes by year
Minimum:
490.0K
jan 1, 2005
Maximum:
9.56 mln
jan 1, 2014
At the date of observation
Value
Absolute change
Change from previous value
jan 1, 1996
1.65 mln
+1.65 mln
0.0%
jan 1, 1997
1.72 mln
+70.0K
4.24%
jan 1, 2001
2.62 mln
+900.0K
52.33%
jan 1, 2002
1.24 mln
-1.38 mln
-52.67%
jan 1, 2003
600.0K
-640.0K
-51.61%
jan 1, 2004
740.0K
+140.0K
23.33%
jan 1, 2005
490.0K
-250.0K
-33.78%
jan 1, 2006
1.23 mln
+740.0K
151.02%
jan 1, 2007
1.11 mln
-120.0K
-9.76%
jan 1, 2008
2.34 mln
+1.23 mln
110.81%
jan 1, 2009
2.96 mln
+620.0K
26.5%
jan 1, 2010
2.91 mln
-50.0K
-1.69%
jan 1, 2011
3.48 mln
+570.0K
19.59%
jan 1, 2012
1.26 mln
-2.22 mln
-63.79%
jan 1, 2013
5.14 mln
+3.88 mln
307.94%
jan 1, 2014
9.56 mln
+4.42 mln
85.99%
jan 1, 2015
5.81 mln
-3.75 mln
-39.23%
Ranking of countries by current statistics by years


Comments: