29
/
en
AIzaSyAYiBZKx7MnpbEhh9jyipgxe19OcubqV5w
April 1, 2024
221242
Paraguay
PRY
true
2
1
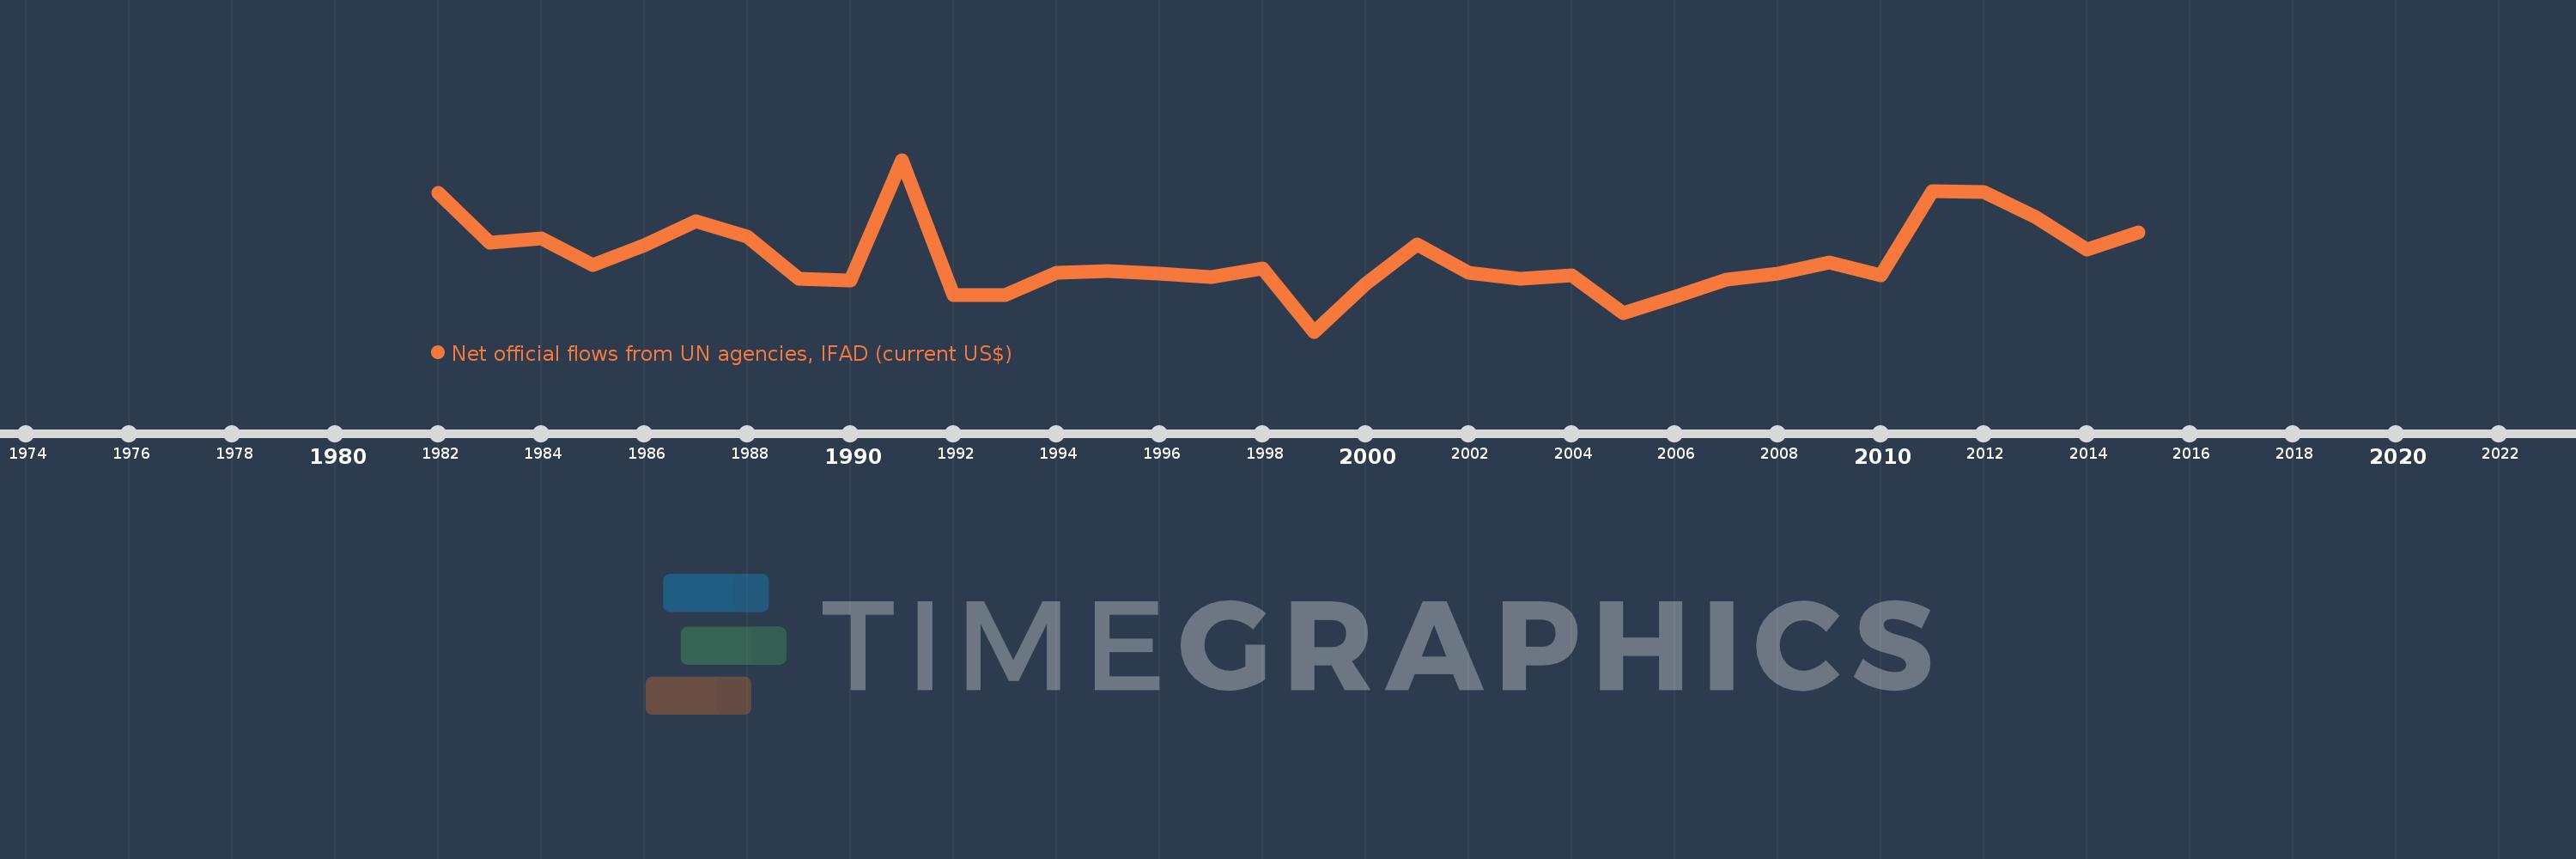
Net official flows from UN agencies, IFAD (current US$)
2015,2014,2013,2012,2011,2010,2009,2008,2007,2006,2005,2004,2003,2002,2001,2000,1999,1998,1997,1996,1995,1994,1993,1992,1991,1990,1989,1988,1987,1986,1985,1984,1983,1982
This statistics in other country:
Timeline:
This timeline shows a graph from 1982 to 2015 of Paraguay. No data until 1981. Number of actual observations by date: 34.
Source name:
World Development Indicators
Source organization:
Development Assistance Committee of the Organisation for Economic Co-operation and Development, Geographical Distribution of Financial Flows to Developing Countries, Development Co-operation Report, and International Development Statistics database. Data are available online at: www.oecd.org/dac/stats/idsonline.
Categories, topics:
Aid Effectiveness
Last updated:
apr 23, 2017
Indicators value changes by year
Minimum:
-3.37 mln
jan 1, 1999
Maximum:
5.57 mln
jan 1, 1991
At the date of observation
Value
Absolute change
Change from previous value
jan 1, 1982
3.87 mln
+3.87 mln
0.0%
jan 1, 1983
1.24 mln
-2.63 mln
-67.96%
jan 1, 1984
1.5 mln
+260.0K
20.97%
jan 1, 1985
80.0K
-1.42 mln
-94.67%
jan 1, 1986
1.12 mln
+1.04 mln
1.3K%
jan 1, 1987
2.37 mln
+1.25 mln
111.61%
jan 1, 1988
1.59 mln
-780.0K
-32.91%
jan 1, 1989
-620.0K
-2.21 mln
-138.99%
jan 1, 1990
-700.0K
-80.0K
12.9%
jan 1, 1991
5.57 mln
+6.27 mln
-895.71%
jan 1, 1992
-1.47 mln
-7.04 mln
-126.39%
jan 1, 1993
-1.49 mln
-20.0K
1.36%
jan 1, 1994
-320.0K
+1.17 mln
-78.52%
jan 1, 1995
-220.0K
+100.0K
-31.25%
jan 1, 1996
-370.0K
-150.0K
68.18%
jan 1, 1997
-550.0K
-180.0K
48.65%
jan 1, 1998
-80.0K
+470.0K
-85.45%
jan 1, 1999
-3.37 mln
-3.29 mln
4.11K%
jan 1, 2000
-910.0K
+2.46 mln
-73.0%
jan 1, 2001
1.18 mln
+2.09 mln
-229.67%
jan 1, 2002
-300.0K
-1.48 mln
-125.42%
jan 1, 2003
-630.0K
-330.0K
110.0%
jan 1, 2004
-430.0K
+200.0K
-31.75%
jan 1, 2005
-2.42 mln
-1.99 mln
462.79%
jan 1, 2006
-1.55 mln
+870.0K
-35.95%
jan 1, 2007
-680.0K
+870.0K
-56.13%
jan 1, 2008
-360.0K
+320.0K
-47.06%
jan 1, 2009
210.0K
+570.0K
-158.33%
jan 1, 2010
-460.0K
-670.0K
-319.05%
jan 1, 2011
3.95 mln
+4.41 mln
-958.7%
jan 1, 2012
3.9 mln
-50.0K
-1.27%
jan 1, 2013
2.6 mln
-1.3 mln
-33.33%
jan 1, 2014
920.0K
-1.68 mln
-64.62%
jan 1, 2015
1.8 mln
+880.0K
95.65%
Ranking of countries by current statistics by years


Comments: