29
/
en
AIzaSyAYiBZKx7MnpbEhh9jyipgxe19OcubqV5w
April 1, 2024
212091
Niger
NER
true
2
1
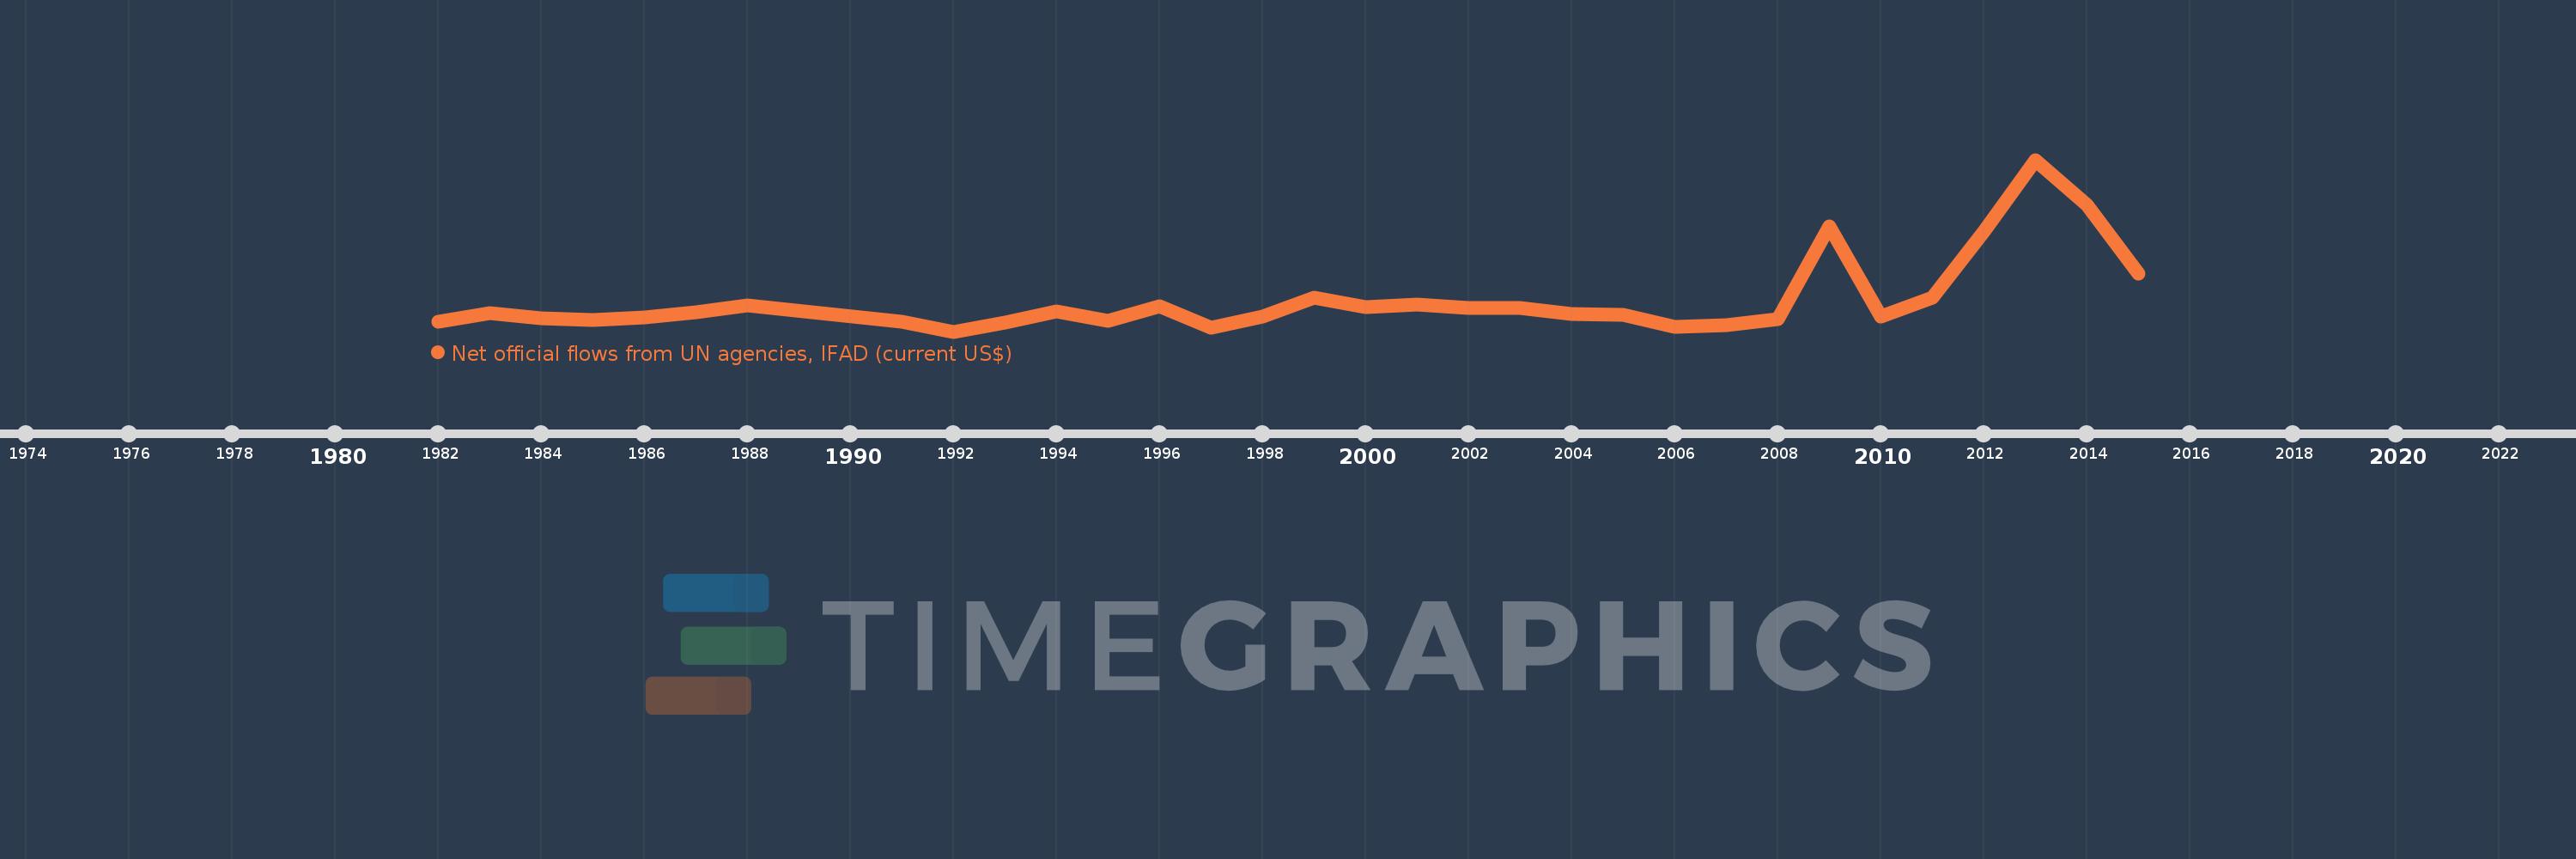
Net official flows from UN agencies, IFAD (current US$)
2015,2014,2013,2012,2011,2010,2009,2008,2007,2006,2005,2004,2003,2002,2001,2000,1999,1998,1997,1996,1995,1994,1993,1992,1991,1988,1987,1986,1985,1984,1983,1982
This statistics in other country:
Timeline:
This timeline shows a graph from 1982 to 2015 of Niger. No data until 1981. Number of actual observations by date: 32.
Source name:
World Development Indicators
Source organization:
Development Assistance Committee of the Organisation for Economic Co-operation and Development, Geographical Distribution of Financial Flows to Developing Countries, Development Co-operation Report, and International Development Statistics database. Data are available online at: www.oecd.org/dac/stats/idsonline.
Categories, topics:
Aid Effectiveness
Last updated:
apr 23, 2017
Indicators value changes by year
Minimum:
-320.0K
jan 1, 1992
Maximum:
15.61 mln
jan 1, 2013
At the date of observation
Value
Absolute change
Change from previous value
jan 1, 1982
630.0K
+630.0K
0.0%
jan 1, 1983
1.42 mln
+790.0K
125.4%
jan 1, 1984
940.0K
-480.0K
-33.8%
jan 1, 1985
790.0K
-150.0K
-15.96%
jan 1, 1986
1.01 mln
+220.0K
27.85%
jan 1, 1987
1.5 mln
+490.0K
48.51%
jan 1, 1988
2.11 mln
+610.0K
40.67%
jan 1, 1991
610.0K
-1.5 mln
-71.09%
jan 1, 1992
-320.0K
-930.0K
-152.46%
jan 1, 1993
550.0K
+870.0K
-271.88%
jan 1, 1994
1.53 mln
+980.0K
178.18%
jan 1, 1995
710.0K
-820.0K
-53.59%
jan 1, 1996
1.99 mln
+1.28 mln
180.28%
jan 1, 1997
20.0K
-1.97 mln
-98.99%
jan 1, 1998
1.04 mln
+1.02 mln
5.1K%
jan 1, 1999
2.84 mln
+1.8 mln
173.08%
jan 1, 2000
1.95 mln
-890.0K
-31.34%
jan 1, 2001
2.18 mln
+230.0K
11.79%
jan 1, 2002
1.88 mln
-300.0K
-13.76%
jan 1, 2003
1.91 mln
+30.0K
1.6%
jan 1, 2004
1.3 mln
-610.0K
-31.94%
jan 1, 2005
1.27 mln
-30.0K
-2.31%
jan 1, 2006
130.0K
-1.14 mln
-89.76%
jan 1, 2007
290.0K
+160.0K
123.08%
jan 1, 2008
860.0K
+570.0K
196.55%
jan 1, 2009
9.41 mln
+8.55 mln
994.19%
jan 1, 2010
1.05 mln
-8.36 mln
-88.84%
jan 1, 2011
2.82 mln
+1.77 mln
168.57%
jan 1, 2012
8.93 mln
+6.11 mln
216.67%
jan 1, 2013
15.61 mln
+6.68 mln
74.8%
jan 1, 2014
11.41 mln
-4.2 mln
-26.91%
jan 1, 2015
5.08 mln
-6.33 mln
-55.48%
Ranking of countries by current statistics by years


Comments: