29
/
en
AIzaSyAYiBZKx7MnpbEhh9jyipgxe19OcubqV5w
April 1, 2024
255530
Swaziland
SWZ
true
2
1
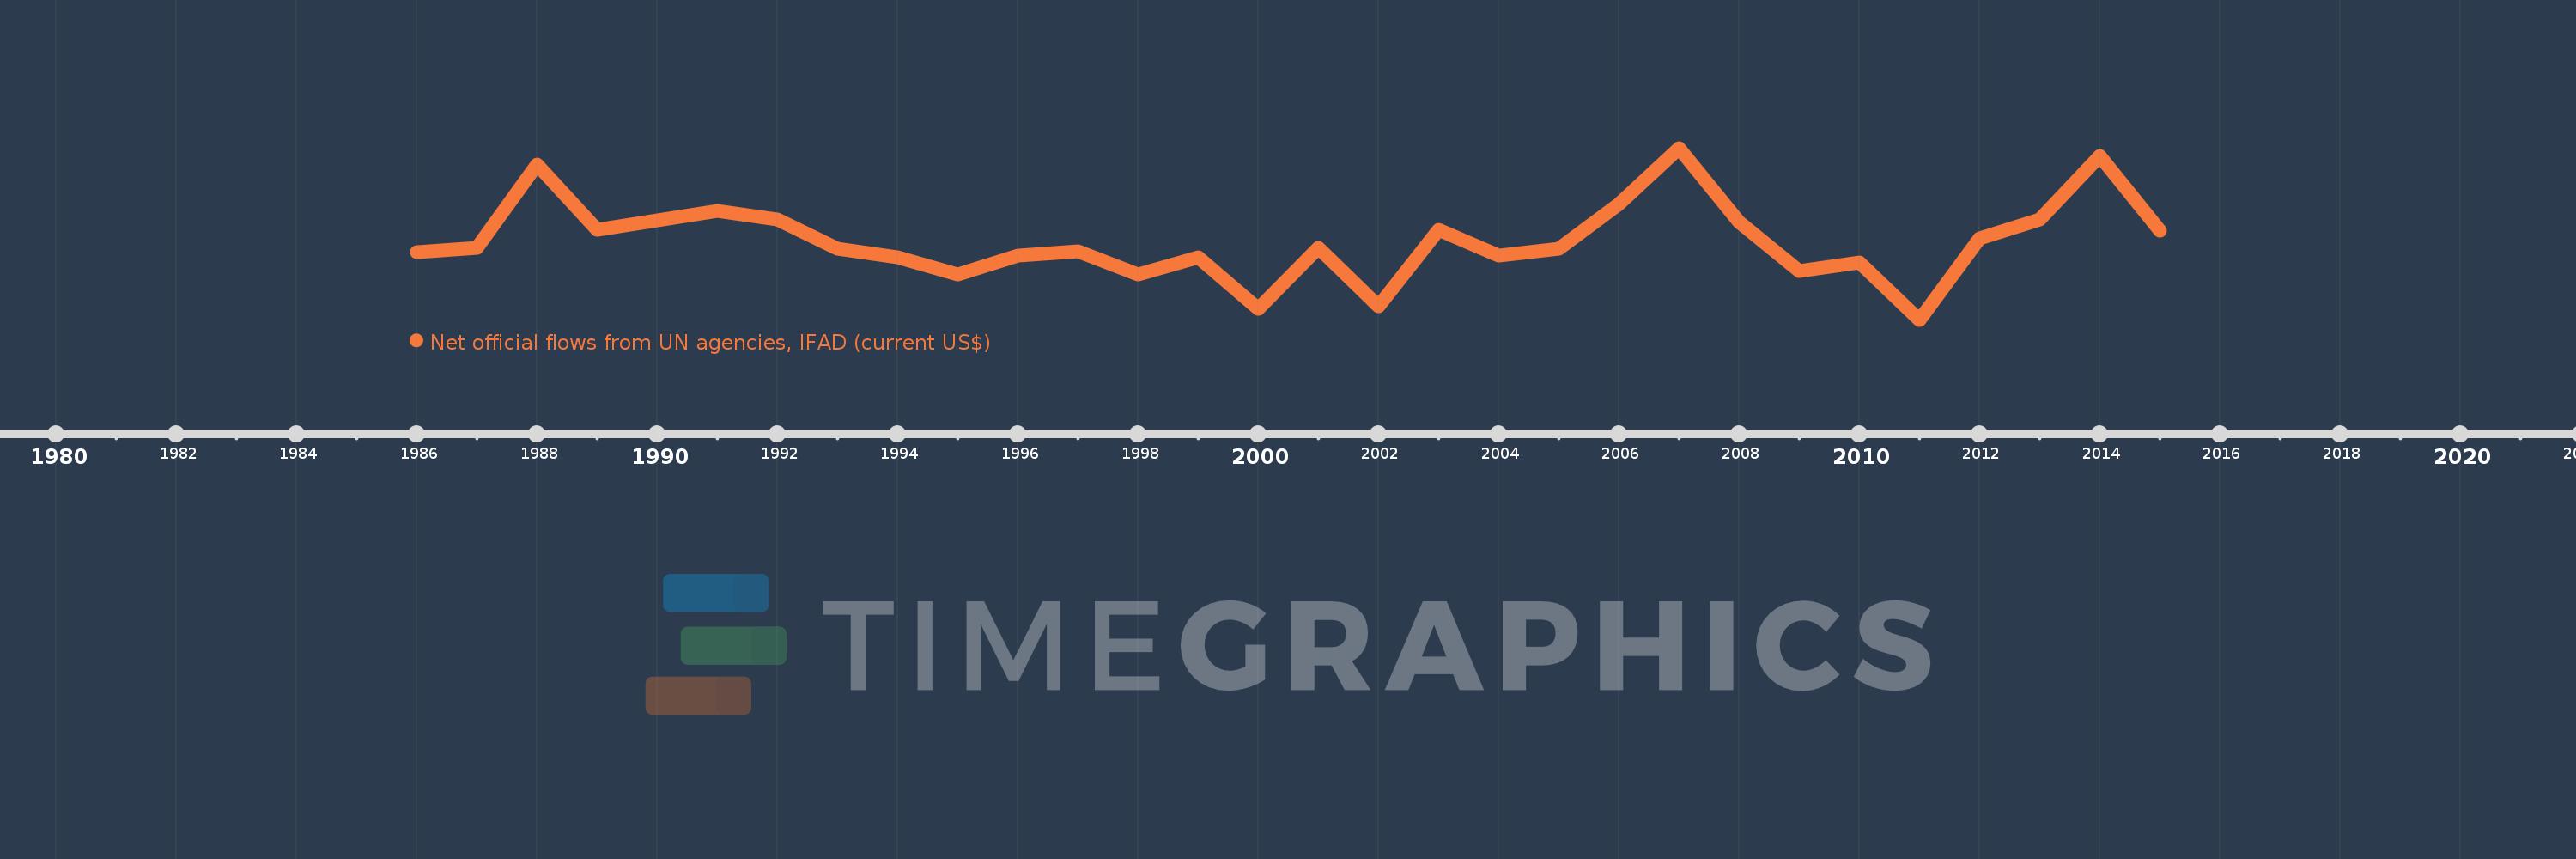
Net official flows from UN agencies, IFAD (current US$)
2015,2014,2013,2012,2011,2010,2009,2008,2007,2006,2005,2004,2003,2002,2001,2000,1999,1998,1997,1996,1995,1994,1993,1992,1991,1989,1988,1987,1986
This statistics in other country:
Timeline:
This timeline shows a graph from 1986 to 2015 of Swaziland. No data until 1985. Number of actual observations by date: 29.
Source name:
World Development Indicators
Source organization:
Development Assistance Committee of the Organisation for Economic Co-operation and Development, Geographical Distribution of Financial Flows to Developing Countries, Development Co-operation Report, and International Development Statistics database. Data are available online at: www.oecd.org/dac/stats/idsonline.
Categories, topics:
Aid Effectiveness
Last updated:
apr 23, 2017
Indicators value changes by year
Minimum:
-1.11 mln
jan 1, 2011
Maximum:
2.15 mln
jan 1, 2007
At the date of observation
Value
Absolute change
Change from previous value
jan 1, 1986
180.0K
+180.0K
0.0%
jan 1, 1987
250.0K
+70.0K
38.89%
jan 1, 1988
1.84 mln
+1.59 mln
636.0%
jan 1, 1989
600.0K
-1.24 mln
-67.39%
jan 1, 1991
950.0K
+350.0K
58.33%
jan 1, 1992
800.0K
-150.0K
-15.79%
jan 1, 1993
240.0K
-560.0K
-70.0%
jan 1, 1994
70.0K
-170.0K
-70.83%
jan 1, 1995
-250.0K
-320.0K
-457.14%
jan 1, 1996
100.0K
+350.0K
-140.0%
jan 1, 1997
190.0K
+90.0K
90.0%
jan 1, 1998
-250.0K
-440.0K
-231.58%
jan 1, 1999
70.0K
+320.0K
-128.0%
jan 1, 2000
-900.0K
-970.0K
-1.39K%
jan 1, 2001
250.0K
+1.15 mln
-127.78%
jan 1, 2002
-860.0K
-1.11 mln
-444.0%
jan 1, 2003
590.0K
+1.45 mln
-168.6%
jan 1, 2004
100.0K
-490.0K
-83.05%
jan 1, 2005
230.0K
+130.0K
130.0%
jan 1, 2006
1.09 mln
+860.0K
373.91%
jan 1, 2007
2.15 mln
+1.06 mln
97.25%
jan 1, 2008
750.0K
-1.4 mln
-65.12%
jan 1, 2009
-180.0K
-930.0K
-124.0%
jan 1, 2010
-20.0K
+160.0K
-88.89%
jan 1, 2011
-1.11 mln
-1.09 mln
5.45K%
jan 1, 2012
440.0K
+1.55 mln
-139.64%
jan 1, 2013
790.0K
+350.0K
79.55%
jan 1, 2014
2.0 mln
+1.21 mln
153.16%
jan 1, 2015
580.0K
-1.42 mln
-71.0%
Ranking of countries by current statistics by years


Comments: