29
/
en
AIzaSyAYiBZKx7MnpbEhh9jyipgxe19OcubqV5w
April 1, 2024
48397
Middle East & North Africa
MEA
false
2
1
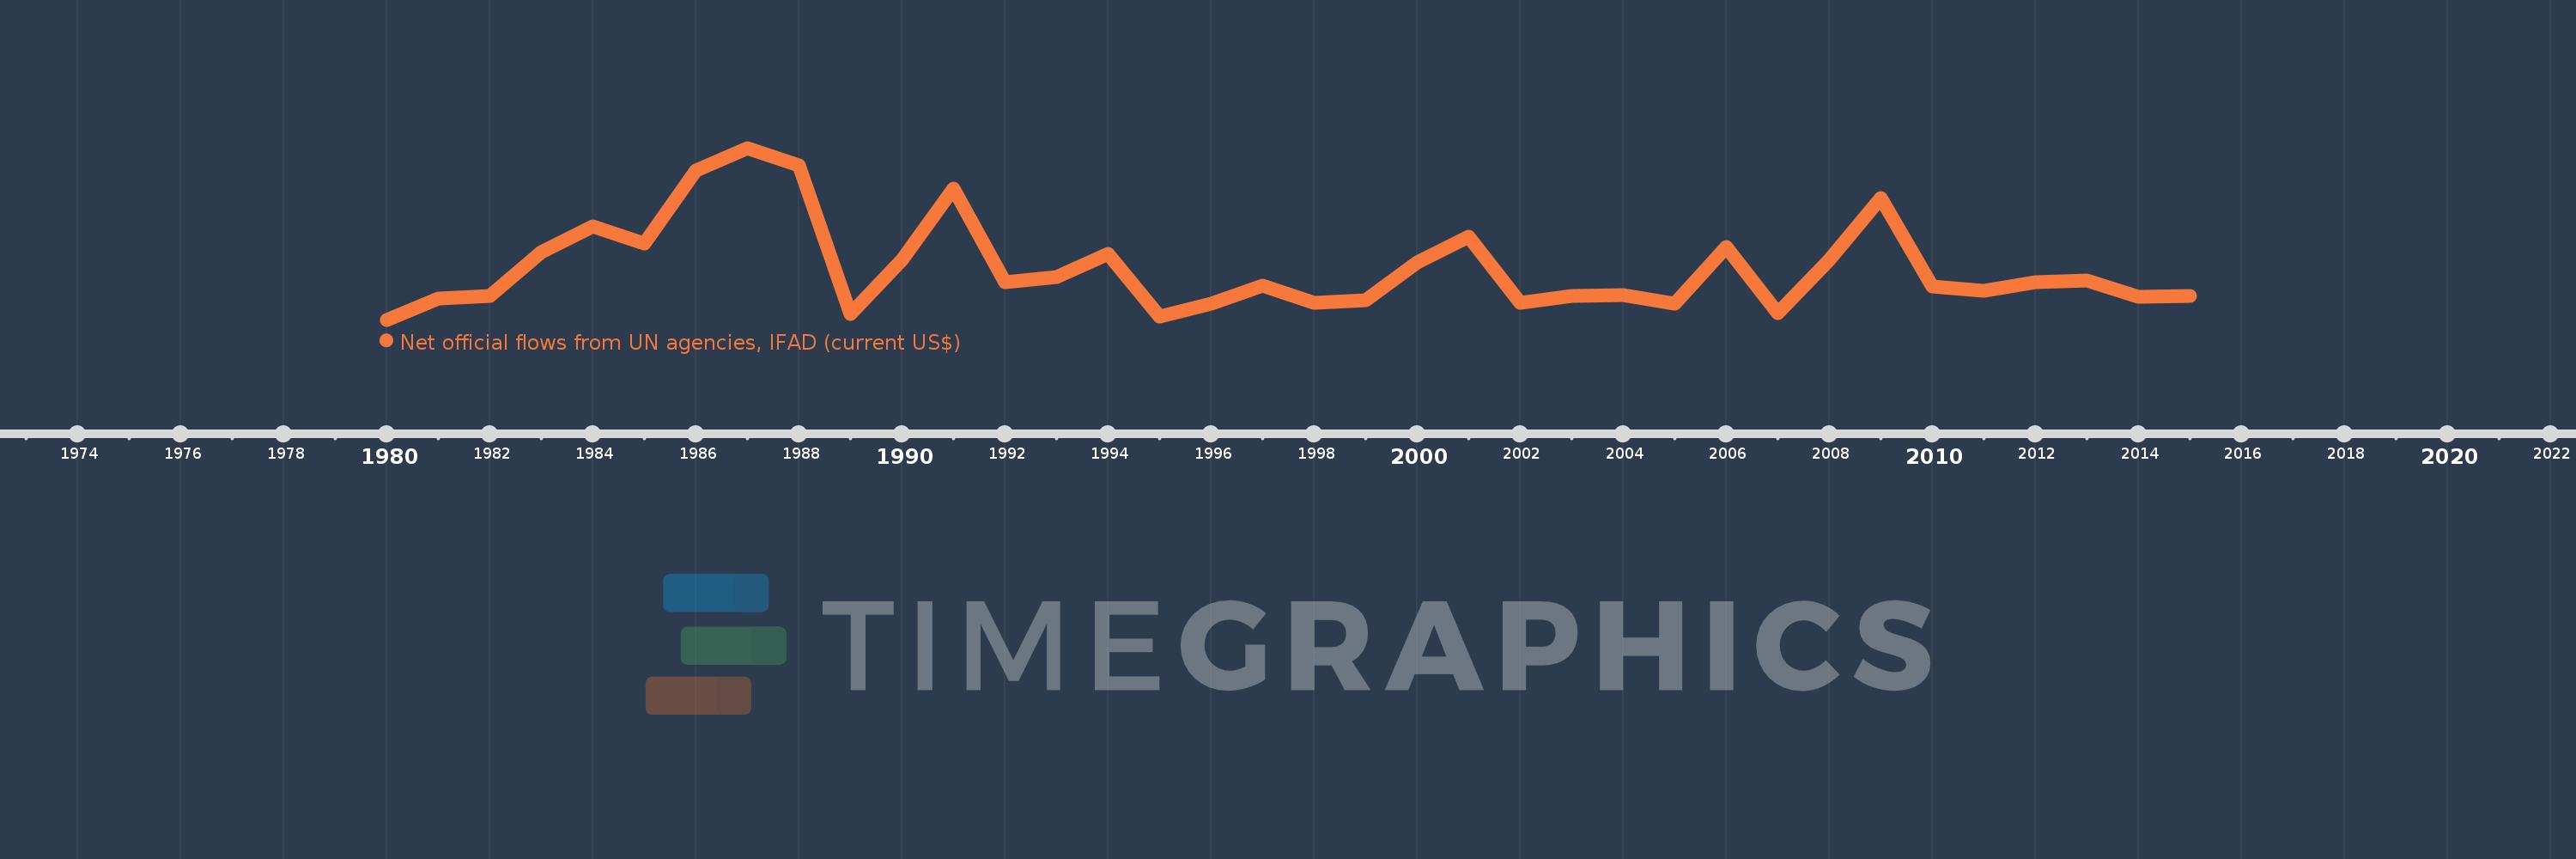
Net official flows from UN agencies, IFAD (current US$)
2015,2014,2013,2012,2011,2010,2009,2008,2007,2006,2005,2004,2003,2002,2001,2000,1999,1998,1997,1996,1995,1994,1993,1992,1991,1990,1989,1988,1987,1986,1985,1984,1983,1982,1981,1980
This statistics in other country:
Timeline:
This timeline shows a graph from 1980 to 2015 of Middle East & North Africa. No data until 1979. Number of actual observations by date: 36.
Source name:
World Development Indicators
Source organization:
Development Assistance Committee of the Organisation for Economic Co-operation and Development, Geographical Distribution of Financial Flows to Developing Countries, Development Co-operation Report, and International Development Statistics database. Data are available online at: www.oecd.org/dac/stats/idsonline.
Categories, topics:
Aid Effectiveness
Last updated:
apr 23, 2017
Indicators value changes by year
Maximum:
34.04 mln
jan 1, 1987
At the date of observation
Value
Absolute change
Change from previous value
jan 1, 1981
4.14 mln
+4.14 mln
%
jan 1, 1982
4.77 mln
+630.0K
15.22%
jan 1, 1983
13.35 mln
+8.58 mln
179.87%
jan 1, 1984
18.53 mln
+5.18 mln
38.8%
jan 1, 1985
15.02 mln
-3.51 mln
-18.94%
jan 1, 1986
29.55 mln
+14.53 mln
96.74%
jan 1, 1987
34.04 mln
+4.49 mln
15.19%
jan 1, 1988
30.57 mln
-3.47 mln
-10.19%
jan 1, 1989
1.18 mln
-29.39 mln
-96.14%
jan 1, 1990
11.78 mln
+10.6 mln
898.31%
jan 1, 1991
25.91 mln
+14.13 mln
119.95%
jan 1, 1992
7.51 mln
-18.4 mln
-71.02%
jan 1, 1993
8.47 mln
+960.0K
12.78%
jan 1, 1994
13.05 mln
+4.58 mln
54.07%
jan 1, 1995
650.0K
-12.4 mln
-95.02%
jan 1, 1996
3.2 mln
+2.55 mln
392.31%
jan 1, 1997
6.74 mln
+3.54 mln
110.63%
jan 1, 1998
3.37 mln
-3.37 mln
-50.0%
jan 1, 1999
3.89 mln
+520.001K
15.43%
jan 1, 2000
11.34 mln
+7.45 mln
191.52%
jan 1, 2001
16.42 mln
+5.08 mln
44.8%
jan 1, 2002
3.4 mln
-13.02 mln
-79.29%
jan 1, 2003
4.64 mln
+1.24 mln
36.47%
jan 1, 2004
4.85 mln
+210.0K
4.53%
jan 1, 2005
3.25 mln
-1.6 mln
-32.99%
jan 1, 2006
14.34 mln
+11.09 mln
341.23%
jan 1, 2007
1.34 mln
-13.0 mln
-90.66%
jan 1, 2008
11.8 mln
+10.46 mln
780.6%
jan 1, 2009
24.15 mln
+12.35 mln
104.66%
jan 1, 2010
6.54 mln
-17.61 mln
-72.92%
jan 1, 2011
5.8 mln
-740.0K
-11.31%
jan 1, 2012
7.48 mln
+1.68 mln
28.97%
jan 1, 2013
7.81 mln
+329.999K
4.41%
jan 1, 2014
4.49 mln
-3.32 mln
-42.51%
jan 1, 2015
4.77 mln
+280.0K
6.24%
Ranking of countries by current statistics by years


Comments: