29
/
en
AIzaSyAYiBZKx7MnpbEhh9jyipgxe19OcubqV5w
April 1, 2024
213361
Nigeria
NGA
true
2
1
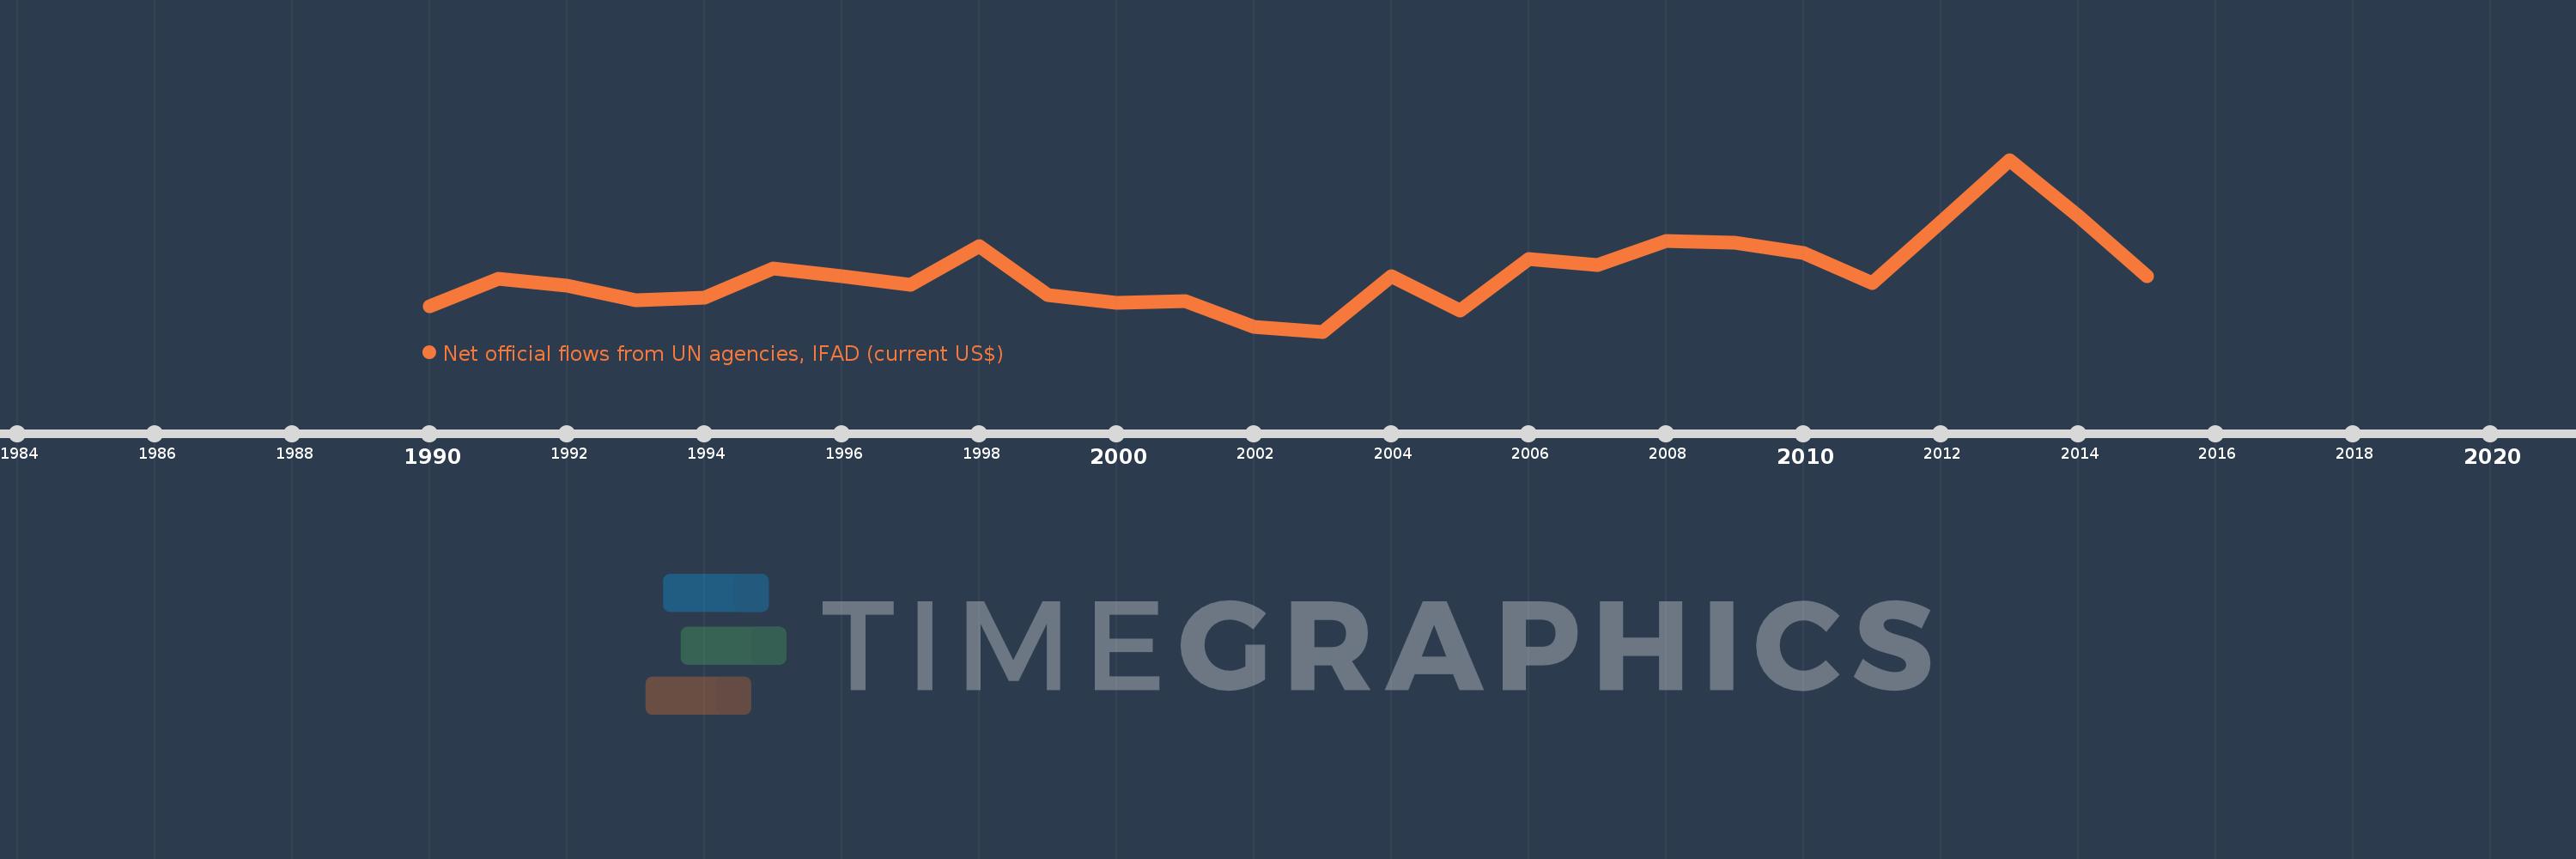
Net official flows from UN agencies, IFAD (current US$)
2015,2014,2013,2012,2011,2010,2009,2008,2007,2006,2005,2004,2003,2002,2001,2000,1999,1998,1997,1996,1995,1994,1993,1992,1991,1990
This statistics in other country:
Timeline:
This timeline shows a graph from 1990 to 2015 of Nigeria. No data until 1989. Number of actual observations by date: 26.
Source name:
World Development Indicators
Source organization:
Development Assistance Committee of the Organisation for Economic Co-operation and Development, Geographical Distribution of Financial Flows to Developing Countries, Development Co-operation Report, and International Development Statistics database. Data are available online at: www.oecd.org/dac/stats/idsonline.
Categories, topics:
Aid Effectiveness
Last updated:
apr 23, 2017
Indicators value changes by year
Minimum:
-1.65 mln
jan 1, 2003
Maximum:
14.03 mln
jan 1, 2013
At the date of observation
Value
Absolute change
Change from previous value
jan 1, 1990
650.0K
+650.0K
0.0%
jan 1, 1991
3.14 mln
+2.49 mln
383.08%
jan 1, 1992
2.54 mln
-600.0K
-19.11%
jan 1, 1993
1.2 mln
-1.34 mln
-52.76%
jan 1, 1994
1.47 mln
+270.0K
22.5%
jan 1, 1995
4.13 mln
+2.66 mln
180.95%
jan 1, 1996
3.38 mln
-750.0K
-18.16%
jan 1, 1997
2.6 mln
-780.0K
-23.08%
jan 1, 1998
6.16 mln
+3.56 mln
136.92%
jan 1, 1999
1.71 mln
-4.45 mln
-72.24%
jan 1, 2000
960.0K
-750.0K
-43.86%
jan 1, 2001
1.11 mln
+150.0K
15.63%
jan 1, 2002
-1.2 mln
-2.31 mln
-208.11%
jan 1, 2003
-1.65 mln
-450.0K
37.5%
jan 1, 2004
3.41 mln
+5.06 mln
-306.67%
jan 1, 2005
270.0K
-3.14 mln
-92.08%
jan 1, 2006
5.01 mln
+4.74 mln
1.76K%
jan 1, 2007
4.41 mln
-600.0K
-11.98%
jan 1, 2008
6.66 mln
+2.25 mln
51.02%
jan 1, 2009
6.49 mln
-170.0K
-2.55%
jan 1, 2010
5.53 mln
-960.0K
-14.79%
jan 1, 2011
2.8 mln
-2.73 mln
-49.37%
jan 1, 2012
8.35 mln
+5.55 mln
198.21%
jan 1, 2013
14.03 mln
+5.68 mln
68.02%
jan 1, 2014
8.88 mln
-5.15 mln
-36.71%
jan 1, 2015
3.44 mln
-5.44 mln
-61.26%
Ranking of countries by current statistics by years


Comments: