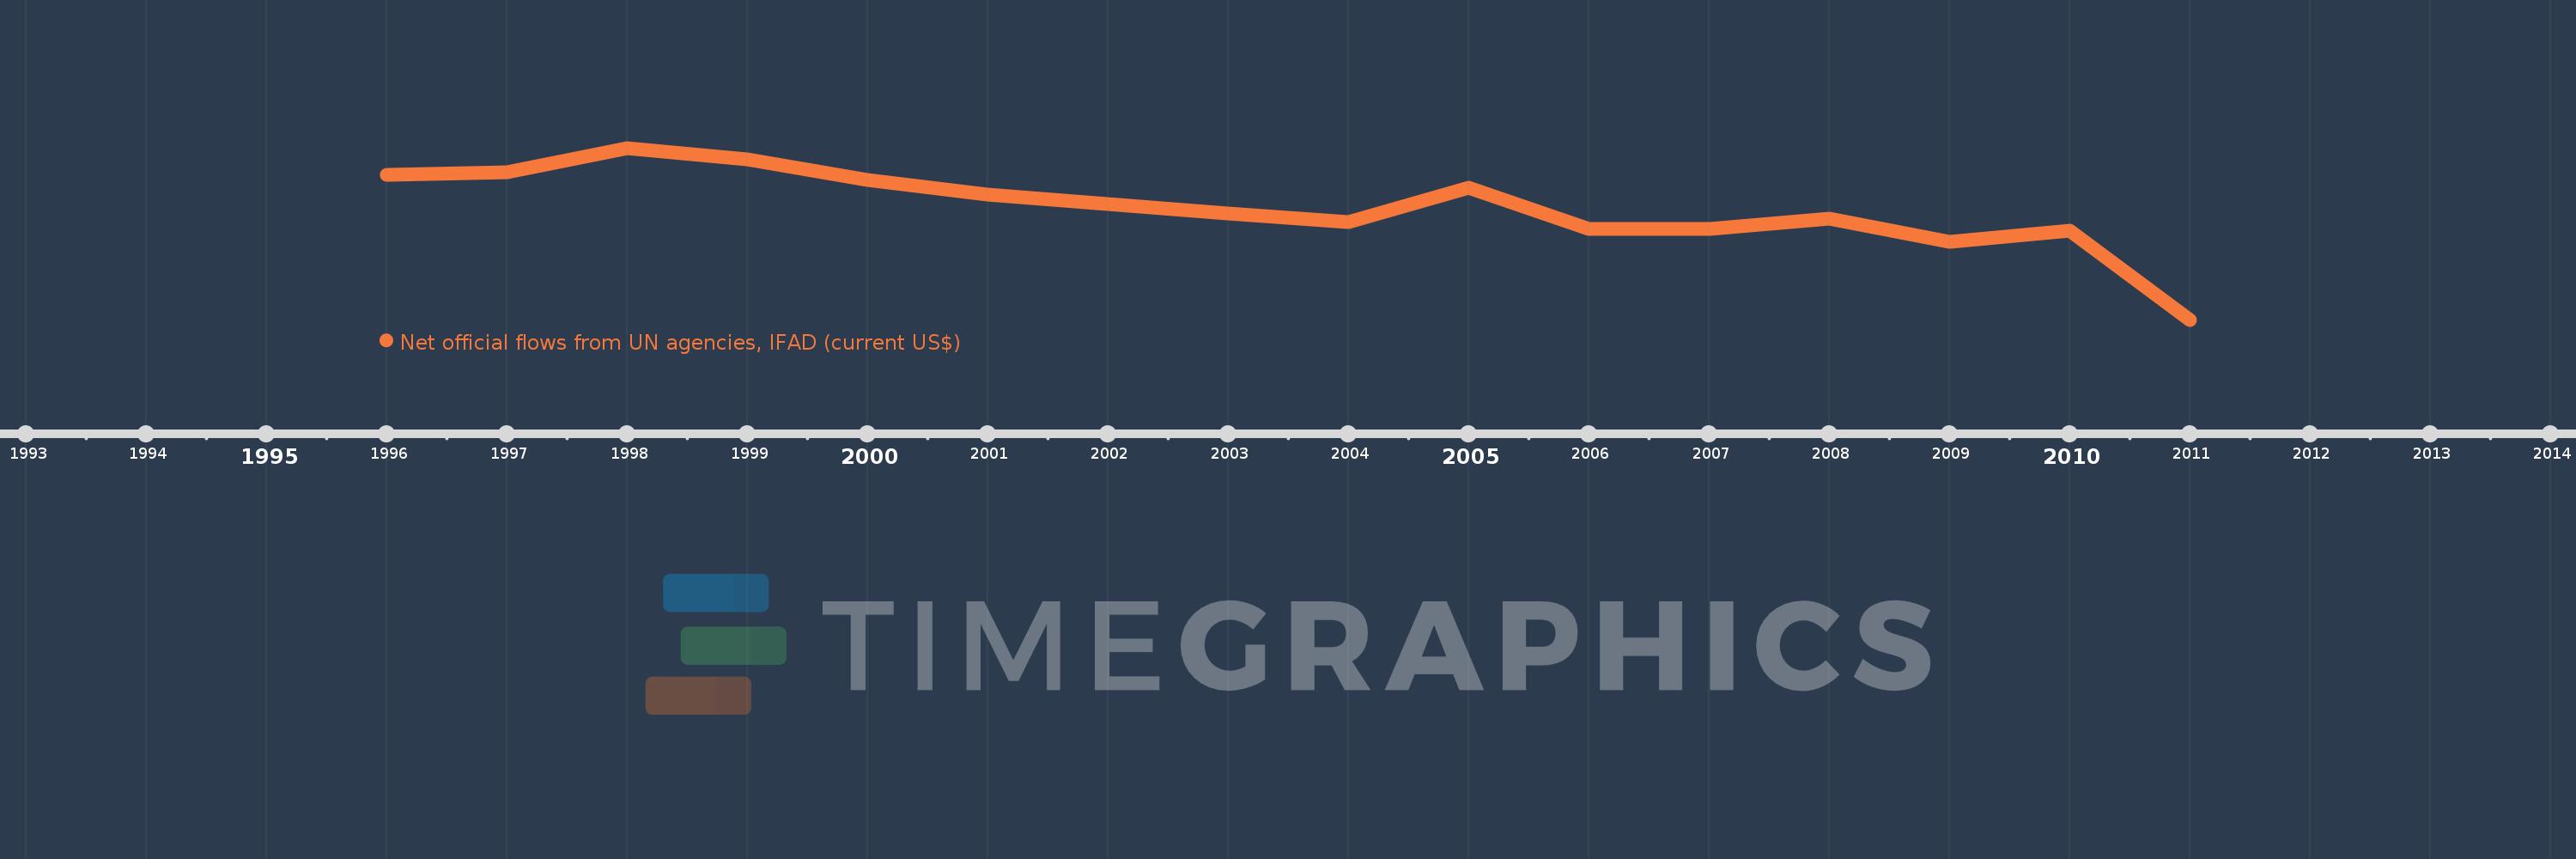
This timeline shows a graph from 1996 to 2011 of Namibia. No data until 1995. Number of actual observations by date: 15.
Source name:
World Development Indicators
Source organization:
Development Assistance Committee of the Organisation for Economic Co-operation and Development, Geographical Distribution of Financial Flows to Developing Countries, Development Co-operation Report, and International Development Statistics database. Data are available online at: www.oecd.org/dac/stats/idsonline.
Categories, topics:
Aid Effectiveness
Last updated:
apr 23, 2017
Indicators value changes by year
Meaning:
-18.0K
Minimum:
-2.13 mln
jan 1, 2011
Maximum:
1.12 mln
jan 1, 1998
At the date of observation
Value
Absolute change
Change from the previous value
jan 1, 1996
610.0K
+610.0K
0.0%
jan 1, 1997
660.0K
+50.0K
8.2%
jan 1, 1998
1.12 mln
+460.0K
69.7%
jan 1, 1999
910.0K
-210.0K
-18.75%
jan 1, 2000
510.0K
-400.0K
-43.96%
jan 1, 2001
230.0K
-280.0K
-54.9%
jan 1, 2003
-120.0K
-350.0K
-152.17%
jan 1, 2004
-280.0K
-160.0K
133.33%
jan 1, 2005
360.0K
+640.0K
-228.57%
jan 1, 2006
-410.0K
-770.0K
-213.89%
jan 1, 2007
-420.0K
-10.0K
2.44%
jan 1, 2008
-210.0K
+210.0K
-50.0%
jan 1, 2009
-660.0K
-450.0K
214.29%
jan 1, 2010
-440.0K
+220.0K
-33.33%
jan 1, 2011
-2.13 mln
-1.69 mln
384.09%
Ranking of countries by current statistics by years
