29
/
en
AIzaSyAYiBZKx7MnpbEhh9jyipgxe19OcubqV5w
April 1, 2024
193394
Mauritania
MRT
true
2
1
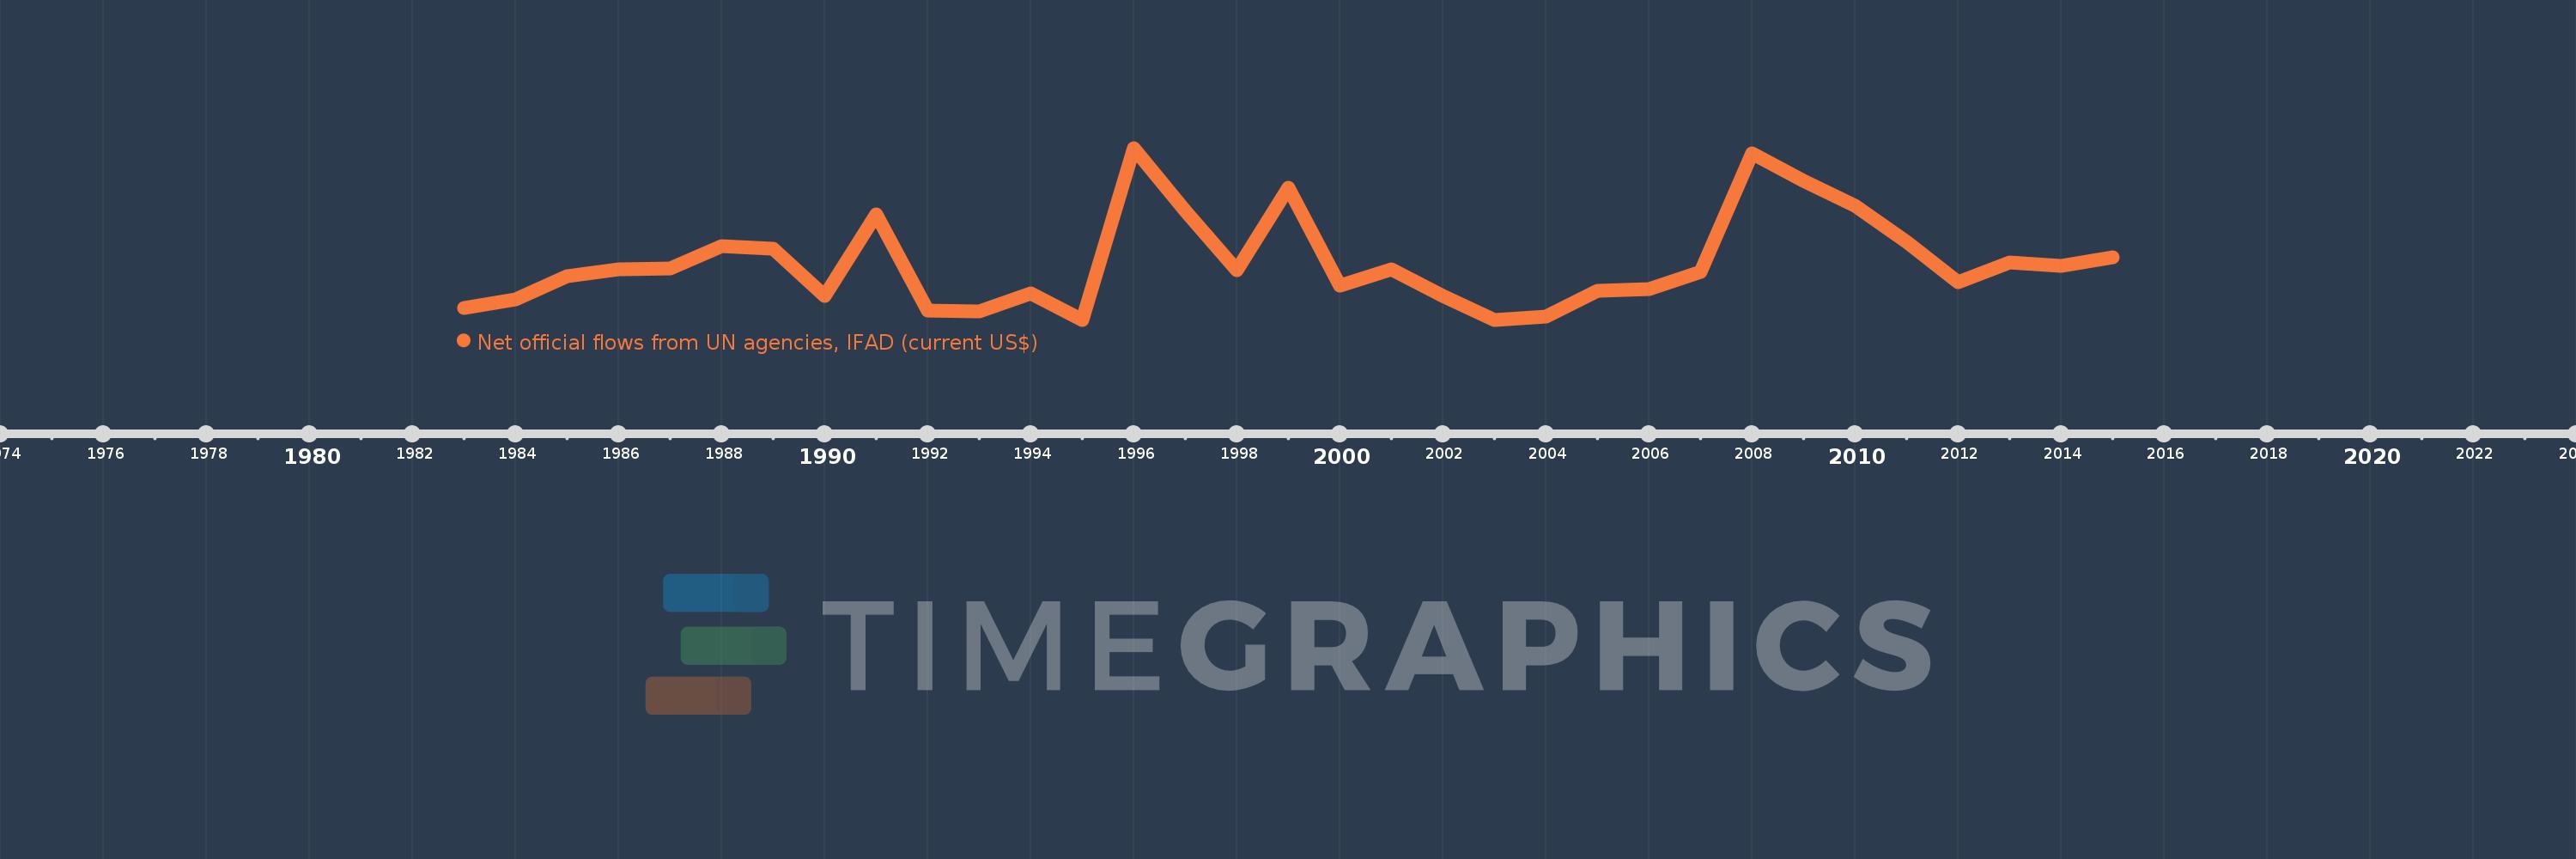
Net official flows from UN agencies, IFAD (current US$)
2015,2014,2013,2012,2011,2010,2009,2008,2007,2006,2005,2004,2003,2002,2001,2000,1999,1998,1997,1996,1995,1994,1993,1992,1991,1990,1989,1988,1987,1986,1985,1984,1983
This statistics in other country:
Timeline:
This timeline shows a graph from 1983 to 2015 of Mauritania. No data until 1982. Number of actual observations by date: 33.
Source name:
World Development Indicators
Source organization:
Development Assistance Committee of the Organisation for Economic Co-operation and Development, Geographical Distribution of Financial Flows to Developing Countries, Development Co-operation Report, and International Development Statistics database. Data are available online at: www.oecd.org/dac/stats/idsonline.
Categories, topics:
Aid Effectiveness
Last updated:
apr 23, 2017
Indicators value changes by year
Minimum:
-270.0K
jan 1, 1995
Maximum:
5.67 mln
jan 1, 1996
At the date of observation
Value
Absolute change
Change from previous value
jan 1, 1983
150.0K
+150.0K
0.0%
jan 1, 1984
440.0K
+290.0K
193.33%
jan 1, 1985
1.25 mln
+810.0K
184.09%
jan 1, 1986
1.48 mln
+230.0K
18.4%
jan 1, 1987
1.51 mln
+30.0K
2.03%
jan 1, 1988
2.28 mln
+770.0K
50.99%
jan 1, 1989
2.2 mln
-80.0K
-3.51%
jan 1, 1990
540.0K
-1.66 mln
-75.45%
jan 1, 1991
3.36 mln
+2.82 mln
522.22%
jan 1, 1992
40.0K
-3.32 mln
-98.81%
jan 1, 1993
10.0K
-30.0K
-75.0%
jan 1, 1994
630.0K
+620.0K
6.2K%
jan 1, 1995
-270.0K
-900.0K
-142.86%
jan 1, 1996
5.67 mln
+5.94 mln
-2.2K%
jan 1, 1997
3.5 mln
-2.17 mln
-38.27%
jan 1, 1998
1.44 mln
-2.06 mln
-58.86%
jan 1, 1999
4.29 mln
+2.85 mln
197.92%
jan 1, 2000
910.0K
-3.38 mln
-78.79%
jan 1, 2001
1.47 mln
+560.0K
61.54%
jan 1, 2002
550.0K
-920.0K
-62.59%
jan 1, 2003
-270.0K
-820.0K
-149.09%
jan 1, 2004
-160.0K
+110.0K
-40.74%
jan 1, 2005
730.0K
+890.0K
-556.25%
jan 1, 2006
780.0K
+50.0K
6.85%
jan 1, 2007
1.39 mln
+610.0K
78.21%
jan 1, 2008
5.48 mln
+4.09 mln
294.24%
jan 1, 2009
4.54 mln
-940.0K
-17.15%
jan 1, 2010
3.68 mln
-860.0K
-18.94%
jan 1, 2011
2.42 mln
-1.26 mln
-34.24%
jan 1, 2012
1.04 mln
-1.38 mln
-57.02%
jan 1, 2013
1.72 mln
+680.0K
65.38%
jan 1, 2014
1.6 mln
-120.0K
-6.98%
jan 1, 2015
1.88 mln
+280.0K
17.5%
Ranking of countries by current statistics by years


Comments: