29
/
en
AIzaSyAYiBZKx7MnpbEhh9jyipgxe19OcubqV5w
April 1, 2024
184274
Macedonia, FYR
MKD
true
2
1
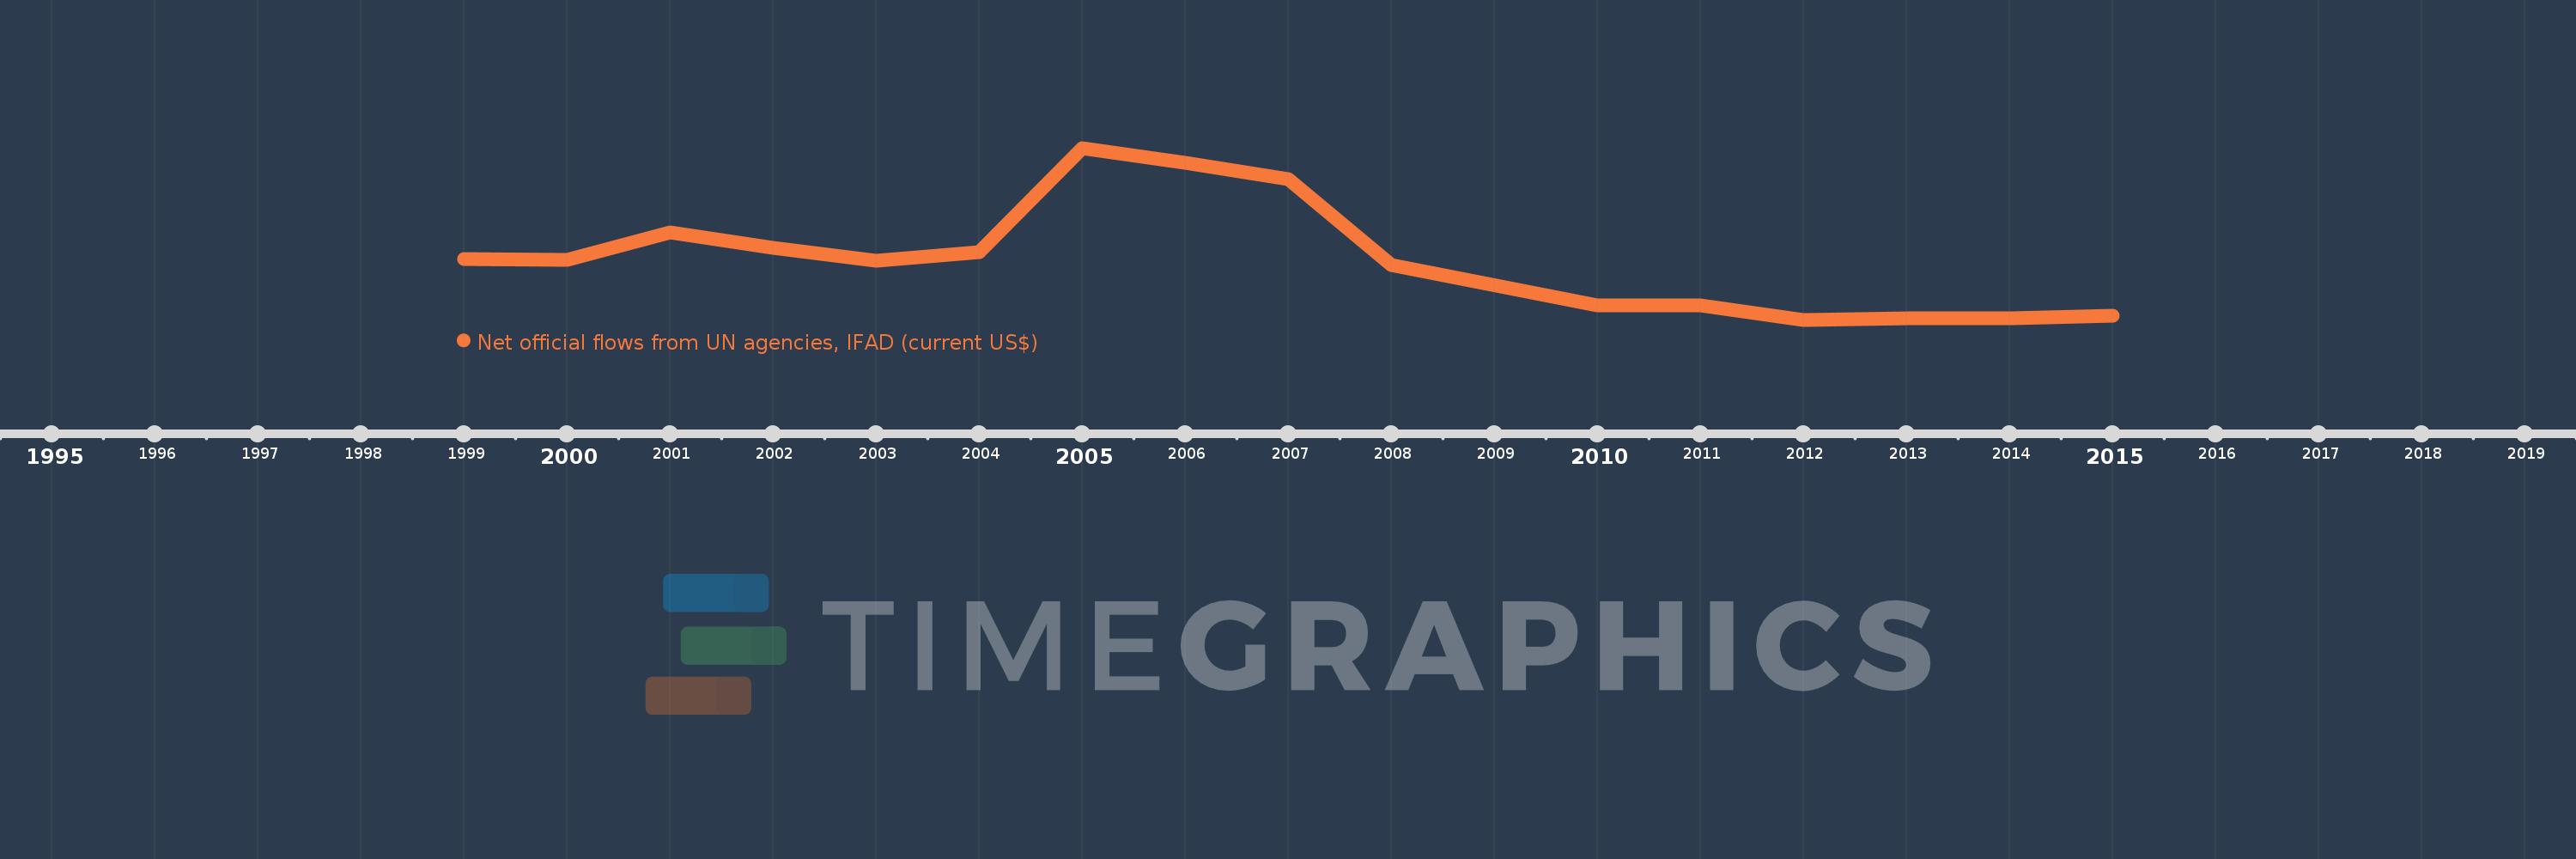
Net official flows from UN agencies, IFAD (current US$)
2015,2014,2013,2012,2011,2010,2008,2007,2006,2005,2004,2003,2002,2001,2000,1999
This statistics in other country:
Timeline:
This timeline shows a graph from 1999 to 2015 of Macedonia, FYR. No data until 1998. Number of actual observations by date: 16.
Source name:
World Development Indicators
Source organization:
Development Assistance Committee of the Organisation for Economic Co-operation and Development, Geographical Distribution of Financial Flows to Developing Countries, Development Co-operation Report, and International Development Statistics database. Data are available online at: www.oecd.org/dac/stats/idsonline.
Categories, topics:
Aid Effectiveness
Last updated:
apr 23, 2017
Indicators value changes by year
Minimum:
-630.0K
jan 1, 2012
Maximum:
3.51 mln
jan 1, 2005
At the date of observation
Value
Absolute change
Change from previous value
jan 1, 1999
840.0K
+840.0K
0.0%
jan 1, 2000
820.0K
-20.0K
-2.38%
jan 1, 2001
1.47 mln
+650.0K
79.27%
jan 1, 2002
1.11 mln
-360.0K
-24.49%
jan 1, 2003
800.0K
-310.0K
-27.93%
jan 1, 2004
1000.0K
+200.0K
25.0%
jan 1, 2005
3.51 mln
+2.51 mln
251.0%
jan 1, 2006
3.16 mln
-350.0K
-9.97%
jan 1, 2007
2.75 mln
-410.0K
-12.97%
jan 1, 2008
680.0K
-2.07 mln
-75.27%
jan 1, 2010
-290.0K
-970.0K
-142.65%
jan 1, 2011
-280.0K
+10.0K
-3.45%
jan 1, 2012
-630.0K
-350.0K
125.0%
jan 1, 2013
-600.0K
+30.0K
-4.76%
jan 1, 2014
-590.0K
+10.0K
-1.67%
jan 1, 2015
-540.0K
+50.0K
-8.47%
Ranking of countries by current statistics by years


Comments: