29
/
en
AIzaSyAYiBZKx7MnpbEhh9jyipgxe19OcubqV5w
April 1, 2024
252220
St. Vincent and the Grenadines
VCT
true
2
1
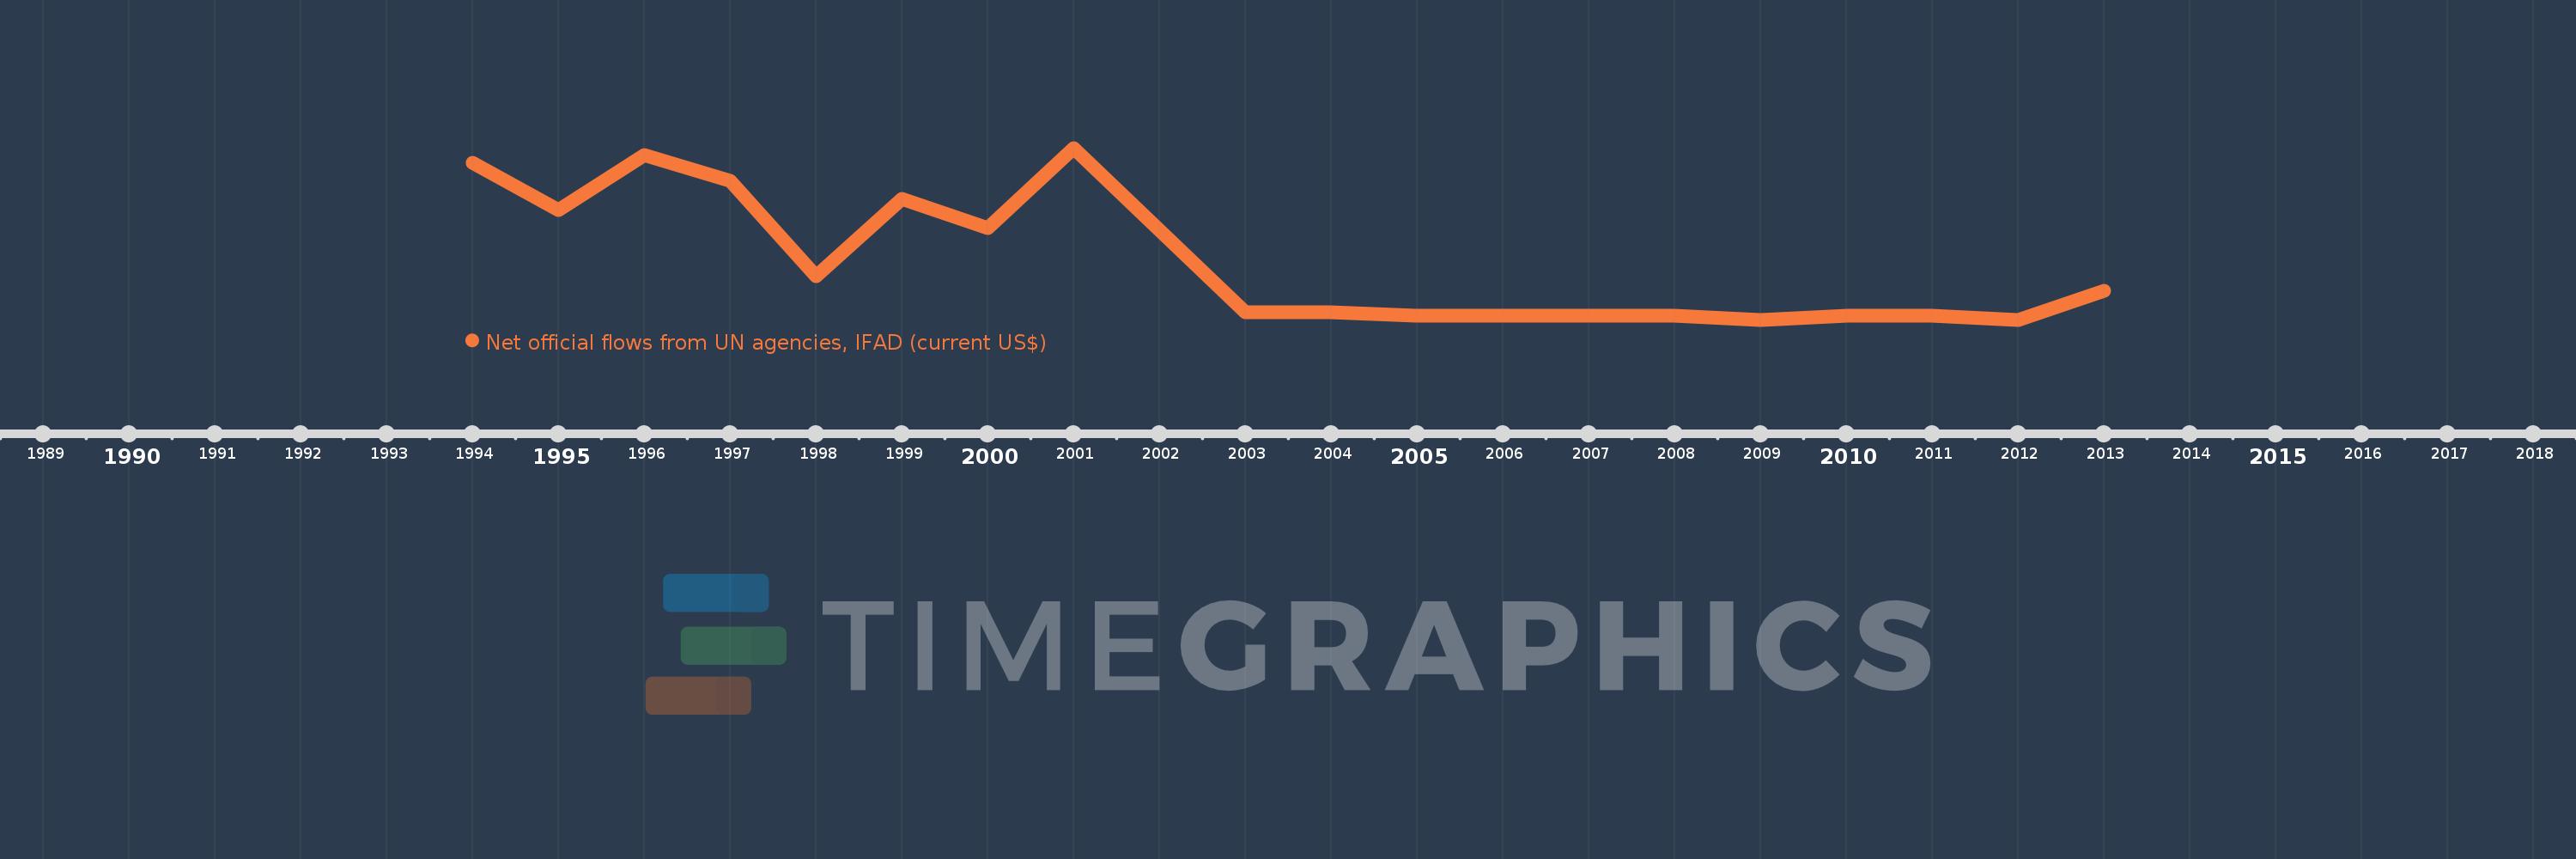
Net official flows from UN agencies, IFAD (current US$)
2013,2012,2011,2010,2009,2008,2007,2006,2005,2004,2003,2001,2000,1999,1998,1997,1996,1995,1994
This statistics in other country:
Timeline:
This timeline shows a graph from 1994 to 2013 of St. Vincent and the Grenadines. No data until 1993. Number of actual observations by date: 19.
Source name:
World Development Indicators
Source organization:
Development Assistance Committee of the Organisation for Economic Co-operation and Development, Geographical Distribution of Financial Flows to Developing Countries, Development Co-operation Report, and International Development Statistics database. Data are available online at: www.oecd.org/dac/stats/idsonline.
Categories, topics:
Aid Effectiveness
Last updated:
apr 23, 2017
Indicators value changes by year
Minimum:
-150.0K
jan 1, 2009
Maximum:
320.0K
jan 1, 2001
At the date of observation
Value
Absolute change
Change from previous value
jan 1, 1994
280.0K
+280.0K
0.0%
jan 1, 1995
150.0K
-130.0K
-46.43%
jan 1, 1996
300.0K
+150.0K
100.0%
jan 1, 1997
230.0K
-70.0K
-23.33%
jan 1, 1998
-30.0K
-260.0K
-113.04%
jan 1, 1999
180.0K
+210.0K
-700.0%
jan 1, 2000
100.0K
-80.0K
-44.44%
jan 1, 2001
320.0K
+220.0K
220.0%
jan 1, 2003
-130.0K
-450.0K
-140.63%
jan 1, 2004
-130.0K
0.0
0.0%
jan 1, 2005
-140.0K
-10.0K
7.69%
jan 1, 2006
-140.0K
0.0
0.0%
jan 1, 2007
-140.0K
0.0
0.0%
jan 1, 2008
-140.0K
0.0
0.0%
jan 1, 2009
-150.0K
-10.0K
7.14%
jan 1, 2010
-140.0K
+10.0K
-6.67%
jan 1, 2011
-140.0K
0.0
0.0%
jan 1, 2012
-150.0K
-10.0K
7.14%
jan 1, 2013
-70.0K
+80.0K
-53.33%
Ranking of countries by current statistics by years


Comments: