29
/
en
AIzaSyAYiBZKx7MnpbEhh9jyipgxe19OcubqV5w
April 1, 2024
222600
Peru
PER
true
2
1
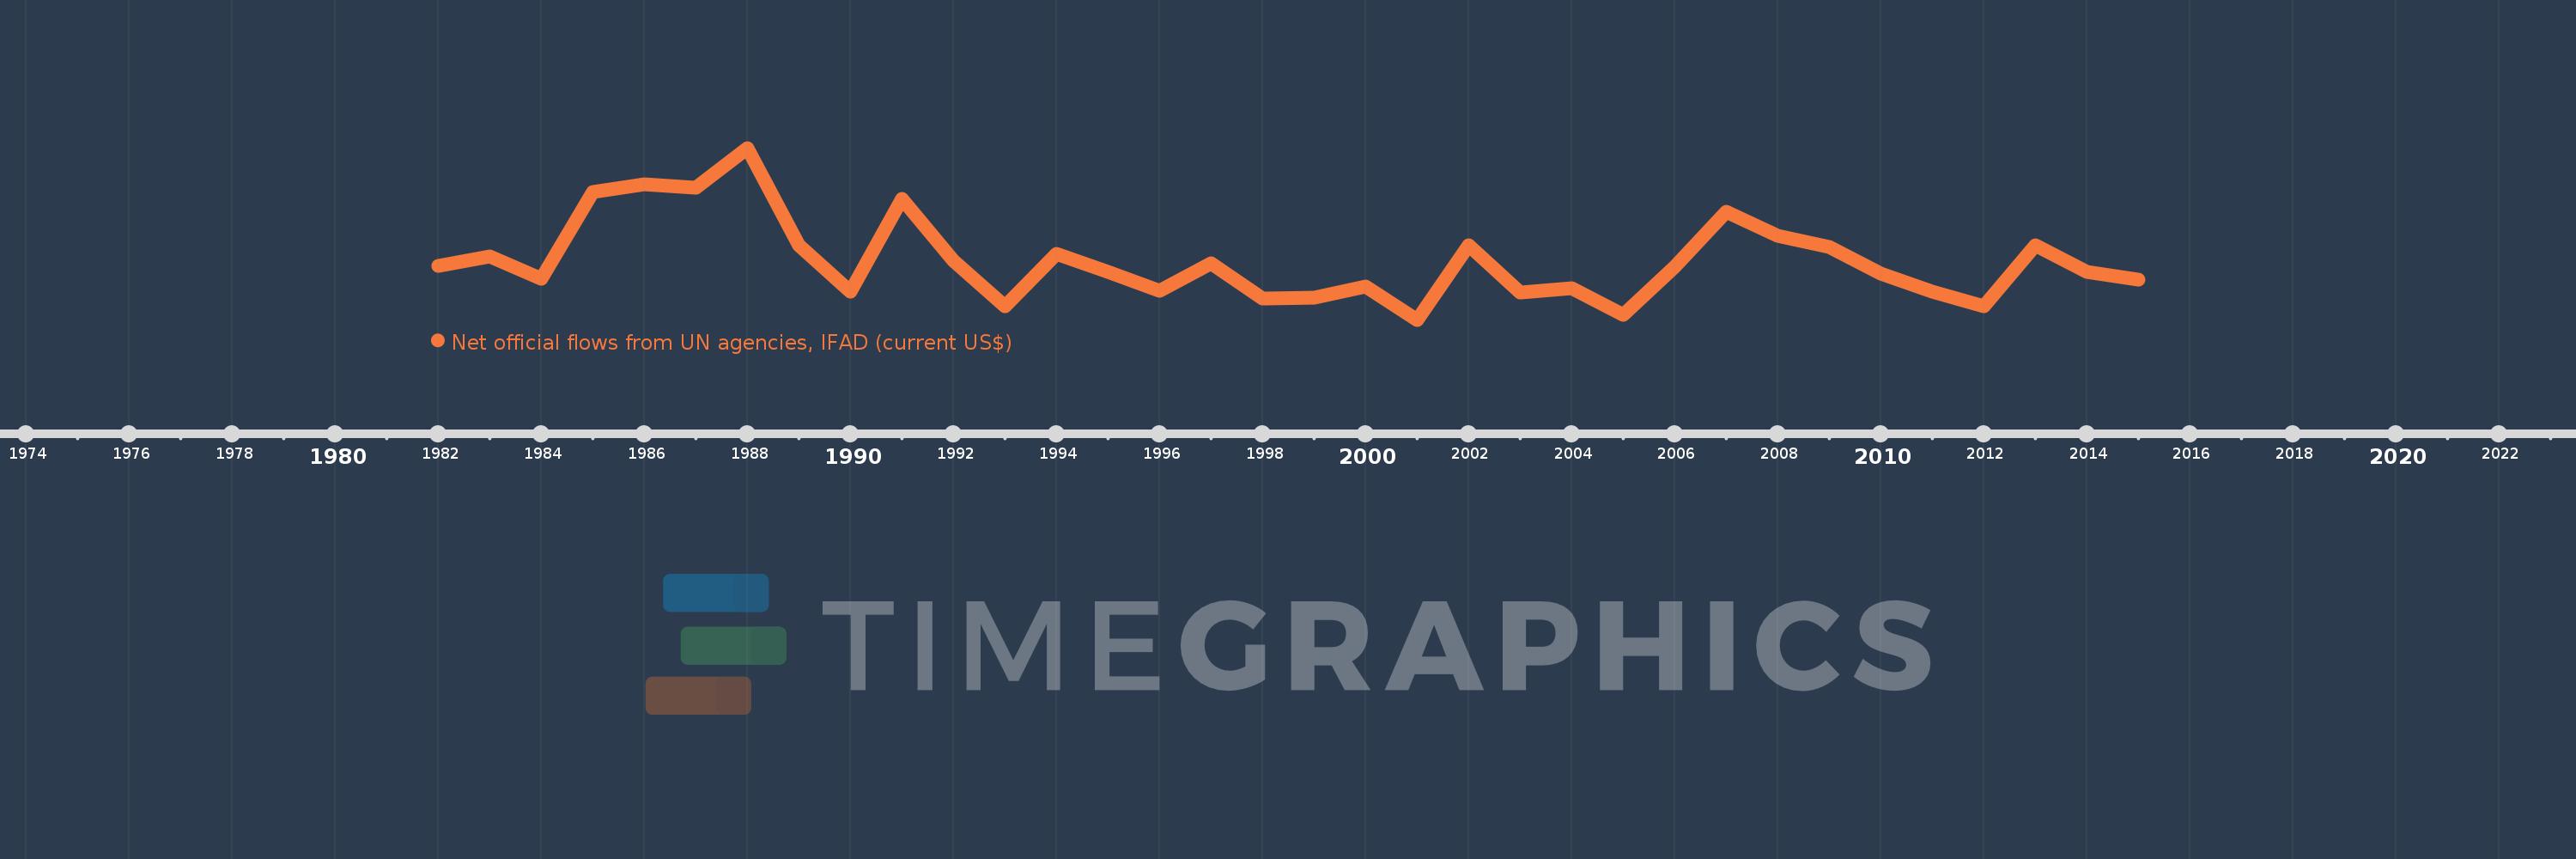
Net official flows from UN agencies, IFAD (current US$)
2015,2014,2013,2012,2011,2010,2009,2008,2007,2006,2005,2004,2003,2002,2001,2000,1999,1998,1997,1996,1995,1994,1993,1992,1991,1990,1989,1988,1987,1986,1985,1984,1983,1982
This statistics in other country:
Timeline:
This timeline shows a graph from 1982 to 2015 of Peru. No data until 1981. Number of actual observations by date: 34.
Source name:
World Development Indicators
Source organization:
Development Assistance Committee of the Organisation for Economic Co-operation and Development, Geographical Distribution of Financial Flows to Developing Countries, Development Co-operation Report, and International Development Statistics database. Data are available online at: www.oecd.org/dac/stats/idsonline.
Categories, topics:
Aid Effectiveness
Last updated:
apr 23, 2017
Indicators value changes by year
Minimum:
-2.24 mln
jan 1, 2001
Maximum:
7.13 mln
jan 1, 1988
At the date of observation
Value
Absolute change
Change from previous value
jan 1, 1982
710.0K
+710.0K
0.0%
jan 1, 1983
1.19 mln
+480.0K
67.61%
jan 1, 1984
10.0K
-1.18 mln
-99.16%
jan 1, 1985
4.73 mln
+4.72 mln
47.2K%
jan 1, 1986
5.14 mln
+410.0K
8.67%
jan 1, 1987
4.94 mln
-200.0K
-3.89%
jan 1, 1988
7.13 mln
+2.19 mln
44.33%
jan 1, 1989
1.8 mln
-5.33 mln
-74.75%
jan 1, 1990
-690.0K
-2.49 mln
-138.33%
jan 1, 1991
4.33 mln
+5.02 mln
-727.54%
jan 1, 1992
980.0K
-3.35 mln
-77.37%
jan 1, 1993
-1.52 mln
-2.5 mln
-255.1%
jan 1, 1994
1.36 mln
+2.88 mln
-189.47%
jan 1, 1995
360.0K
-1000.0K
-73.53%
jan 1, 1996
-640.0K
-1000.0K
-277.78%
jan 1, 1997
830.0K
+1.47 mln
-229.69%
jan 1, 1998
-1.07 mln
-1.9 mln
-228.92%
jan 1, 1999
-1.02 mln
+50.0K
-4.67%
jan 1, 2000
-410.0K
+610.0K
-59.8%
jan 1, 2001
-2.24 mln
-1.83 mln
446.34%
jan 1, 2002
1.8 mln
+4.04 mln
-180.36%
jan 1, 2003
-740.0K
-2.54 mln
-141.11%
jan 1, 2004
-540.0K
+200.0K
-27.03%
jan 1, 2005
-1.96 mln
-1.42 mln
262.96%
jan 1, 2006
630.0K
+2.59 mln
-132.14%
jan 1, 2007
3.63 mln
+3.0 mln
476.19%
jan 1, 2008
2.33 mln
-1.3 mln
-35.81%
jan 1, 2009
1.75 mln
-580.0K
-24.89%
jan 1, 2010
270.0K
-1.48 mln
-84.57%
jan 1, 2011
-730.0K
-1000.0K
-370.37%
jan 1, 2012
-1.52 mln
-790.0K
108.22%
jan 1, 2013
1.84 mln
+3.36 mln
-221.05%
jan 1, 2014
350.0K
-1.49 mln
-80.98%
jan 1, 2015
-70.0K
-420.0K
-120.0%
Ranking of countries by current statistics by years


Comments: