29
/
en
AIzaSyAYiBZKx7MnpbEhh9jyipgxe19OcubqV5w
April 1, 2024
281382
Venezuela, RB
VEN
true
2
1
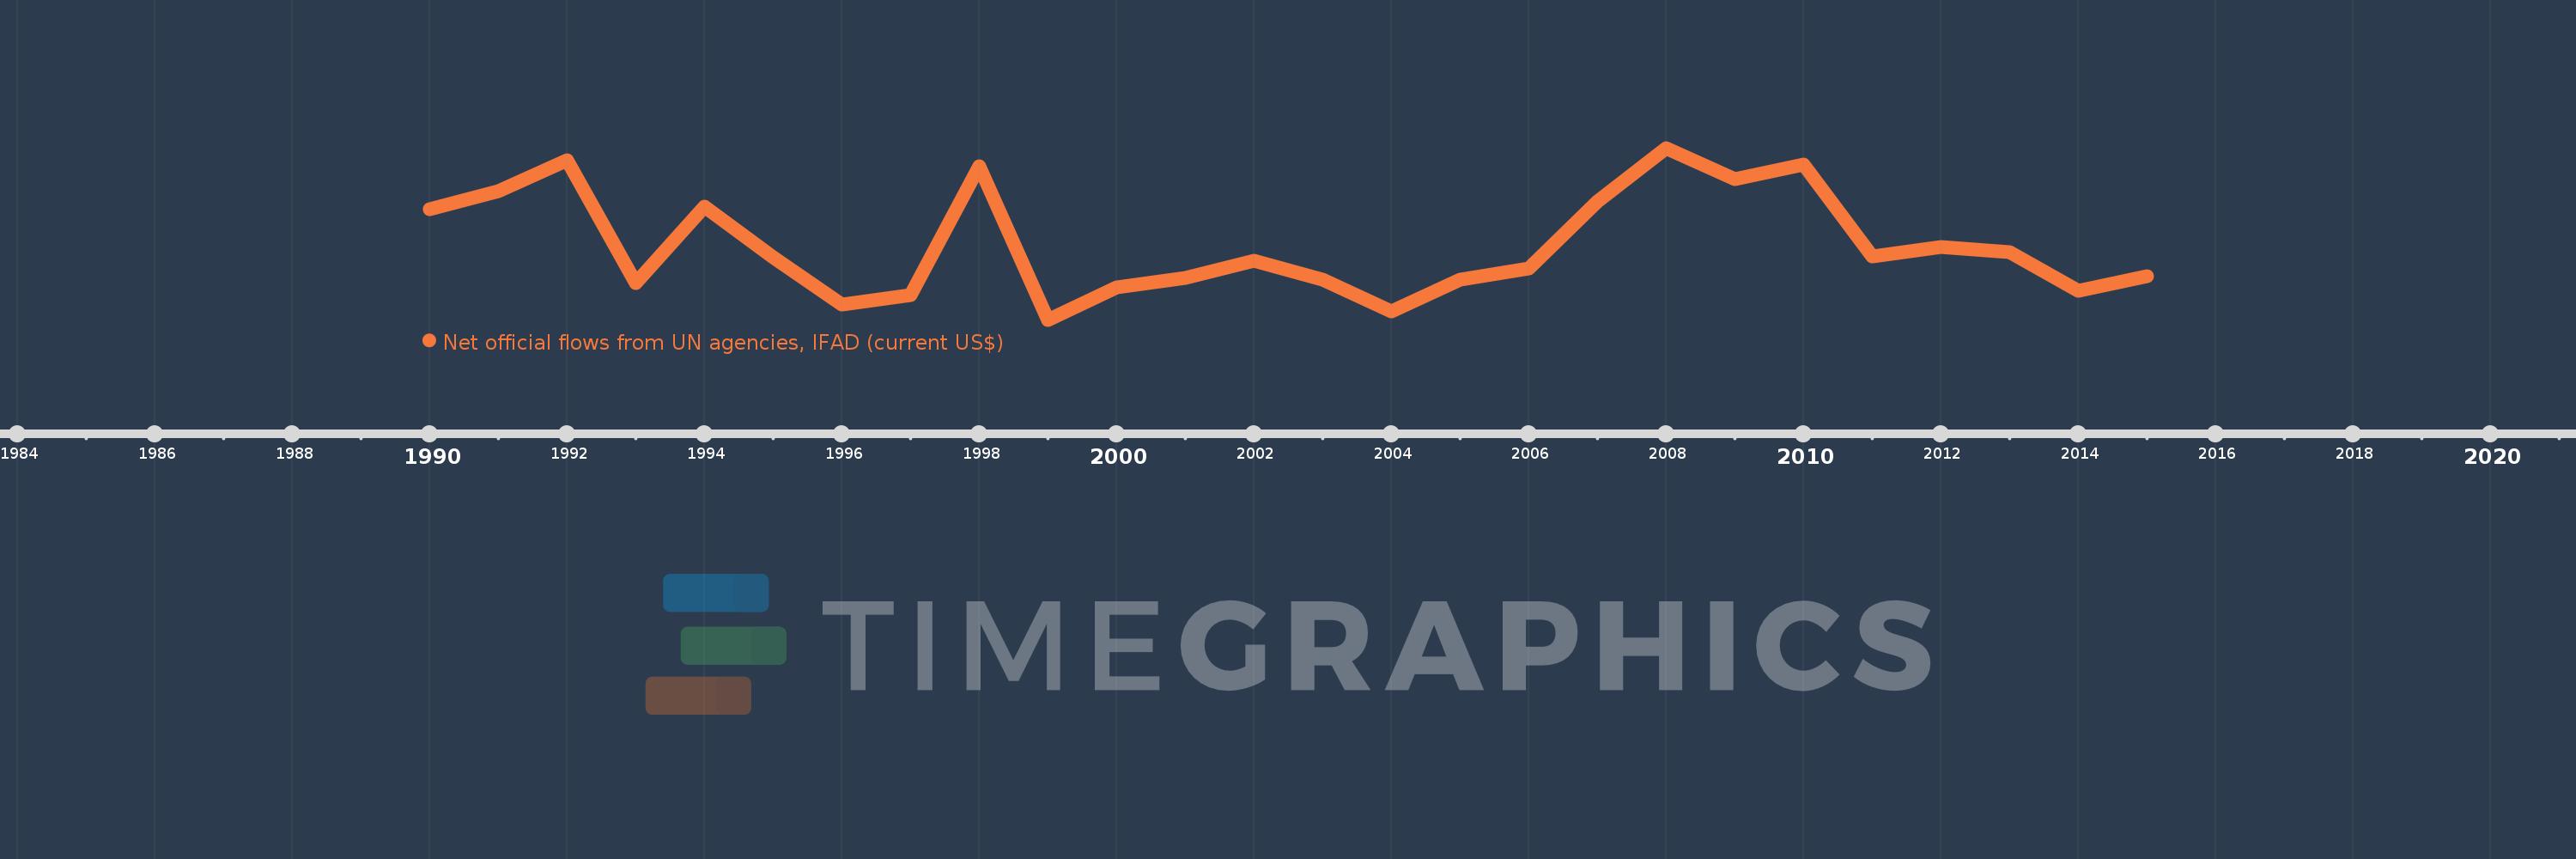
Net official flows from UN agencies, IFAD (current US$)
2015,2014,2013,2012,2011,2010,2009,2008,2007,2006,2005,2004,2003,2002,2001,2000,1999,1998,1997,1996,1995,1994,1993,1992,1991,1990
This statistics in other country:
Timeline:
This timeline shows a graph from 1990 to 2015 of Venezuela, RB. No data until 1989. Number of actual observations by date: 26.
Source name:
World Development Indicators
Source organization:
Development Assistance Committee of the Organisation for Economic Co-operation and Development, Geographical Distribution of Financial Flows to Developing Countries, Development Co-operation Report, and International Development Statistics database. Data are available online at: www.oecd.org/dac/stats/idsonline.
Categories, topics:
Aid Effectiveness
Last updated:
apr 23, 2017
Indicators value changes by year
Minimum:
-2.26 mln
jan 1, 1999
Maximum:
2.91 mln
jan 1, 2008
At the date of observation
Value
Absolute change
Change from previous value
jan 1, 1990
1.07 mln
+1.07 mln
0.0%
jan 1, 1991
1.61 mln
+540.0K
50.47%
jan 1, 1992
2.55 mln
+940.0K
58.39%
jan 1, 1993
-1.15 mln
-3.7 mln
-145.1%
jan 1, 1994
1.15 mln
+2.3 mln
-200.0%
jan 1, 1995
-370.0K
-1.52 mln
-132.17%
jan 1, 1996
-1.8 mln
-1.43 mln
386.49%
jan 1, 1997
-1.51 mln
+290.0K
-16.11%
jan 1, 1998
2.35 mln
+3.86 mln
-255.63%
jan 1, 1999
-2.26 mln
-4.61 mln
-196.17%
jan 1, 2000
-1.28 mln
+980.0K
-43.36%
jan 1, 2001
-1.01 mln
+270.0K
-21.09%
jan 1, 2002
-490.0K
+520.0K
-51.49%
jan 1, 2003
-1.04 mln
-550.0K
112.24%
jan 1, 2004
-2.0 mln
-960.0K
92.31%
jan 1, 2005
-1.05 mln
+950.0K
-47.5%
jan 1, 2006
-720.0K
+330.0K
-31.43%
jan 1, 2007
1.3 mln
+2.02 mln
-280.56%
jan 1, 2008
2.91 mln
+1.61 mln
123.85%
jan 1, 2009
1.96 mln
-950.0K
-32.65%
jan 1, 2010
2.4 mln
+440.0K
22.45%
jan 1, 2011
-360.0K
-2.76 mln
-115.0%
jan 1, 2012
-70.0K
+290.0K
-80.56%
jan 1, 2013
-220.0K
-150.0K
214.29%
jan 1, 2014
-1.39 mln
-1.17 mln
531.82%
jan 1, 2015
-960.0K
+430.0K
-30.94%
Ranking of countries by current statistics by years


Comments: