29
/
en
AIzaSyAYiBZKx7MnpbEhh9jyipgxe19OcubqV5w
April 1, 2024
91557
Brazil
BRA
true
2
1
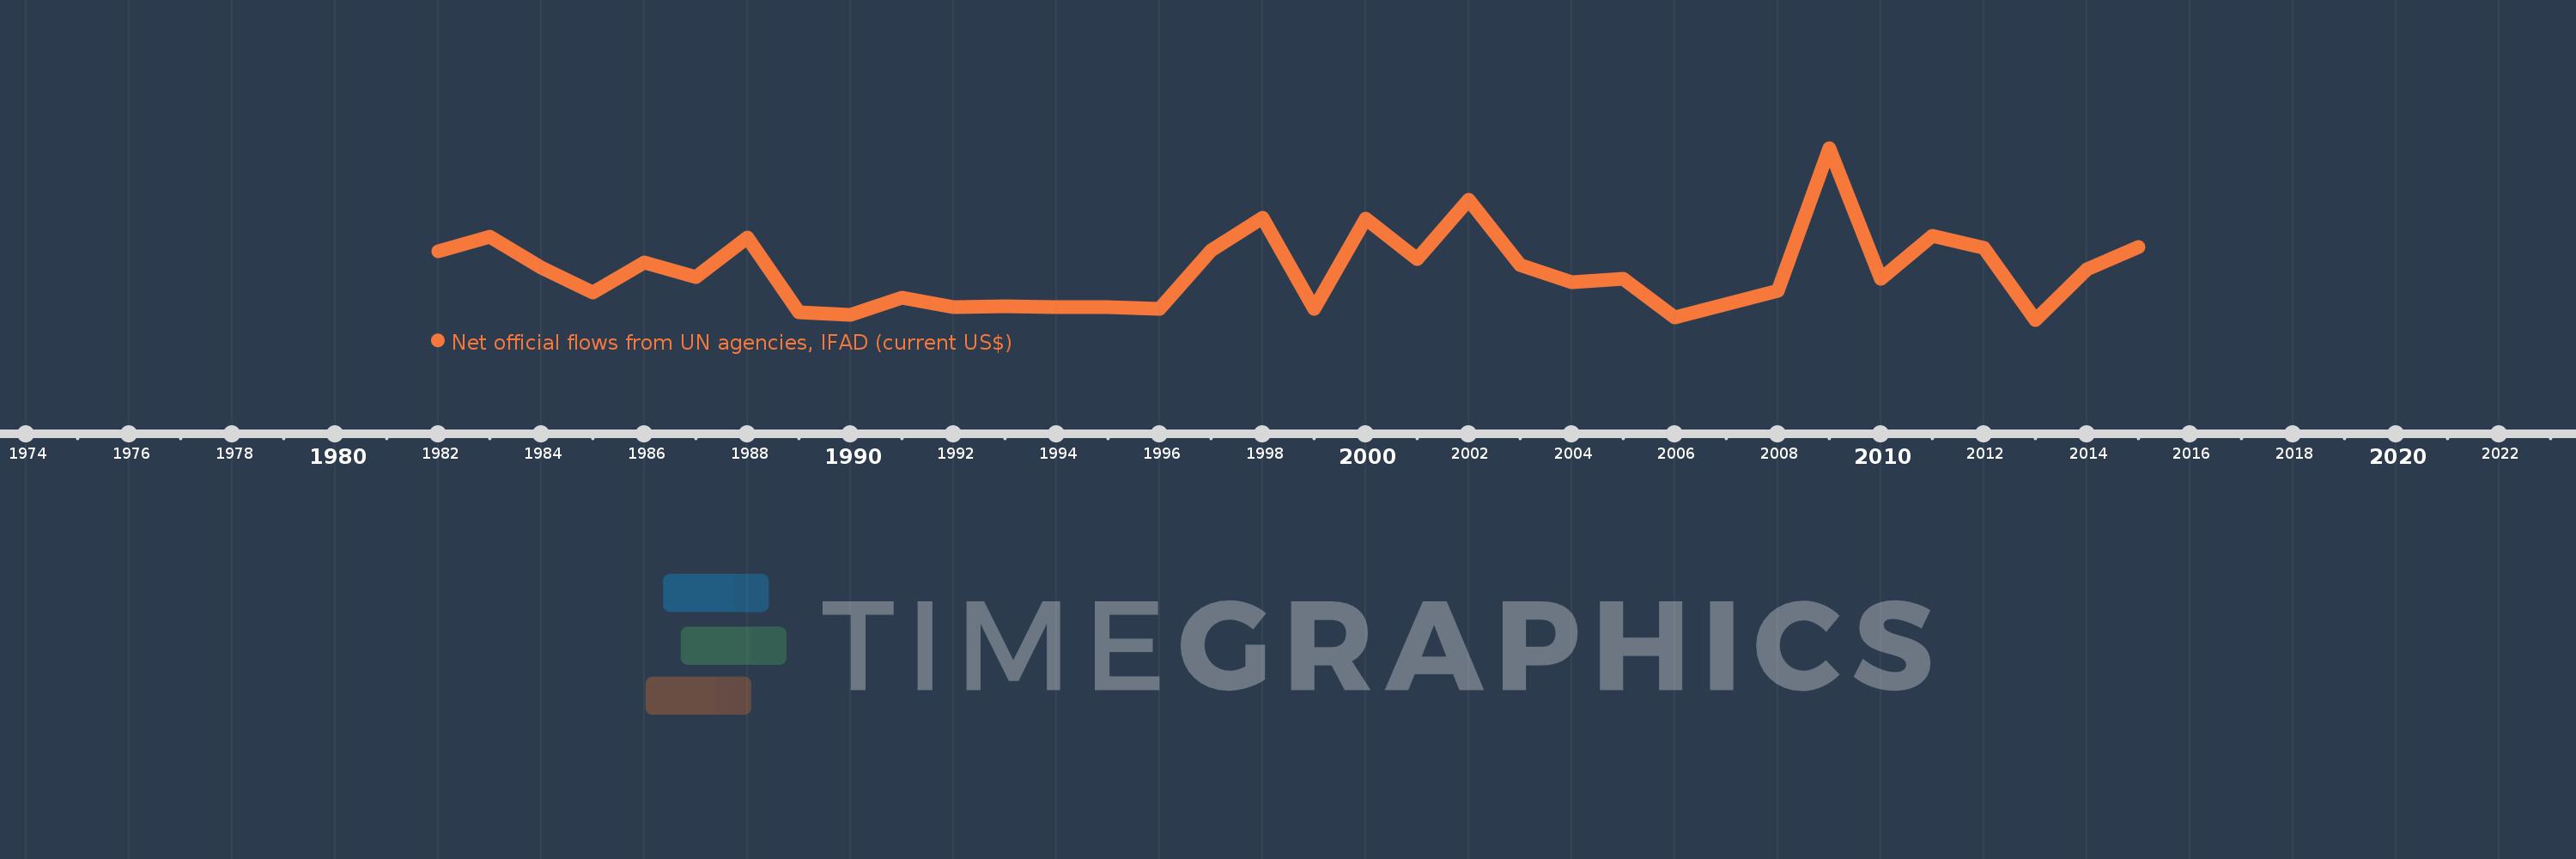
Net official flows from UN agencies, IFAD (current US$)
2015,2014,2013,2012,2011,2010,2009,2008,2006,2005,2004,2003,2002,2001,2000,1999,1998,1997,1996,1995,1994,1993,1992,1991,1990,1989,1988,1987,1986,1985,1984,1983,1982
This statistics in other country:
Timeline:
This timeline shows a graph from 1982 to 2015 of Brazil. No data until 1981. Number of actual observations by date: 33.
Source name:
World Development Indicators
Source organization:
Development Assistance Committee of the Organisation for Economic Co-operation and Development, Geographical Distribution of Financial Flows to Developing Countries, Development Co-operation Report, and International Development Statistics database. Data are available online at: www.oecd.org/dac/stats/idsonline.
Categories, topics:
Aid Effectiveness
Last updated:
apr 23, 2017
Indicators value changes by year
Minimum:
-1.75 mln
jan 1, 2013
Maximum:
7.26 mln
jan 1, 2009
At the date of observation
Value
Absolute change
Change from previous value
jan 1, 1982
1.82 mln
+1.82 mln
0.0%
jan 1, 1983
2.59 mln
+770.0K
42.31%
jan 1, 1984
980.0K
-1.61 mln
-62.16%
jan 1, 1985
-320.0K
-1.3 mln
-132.65%
jan 1, 1986
1.26 mln
+1.58 mln
-493.75%
jan 1, 1987
500.0K
-760.0K
-60.32%
jan 1, 1988
2.54 mln
+2.04 mln
408.0%
jan 1, 1989
-1.36 mln
-3.9 mln
-153.54%
jan 1, 1990
-1.51 mln
-150.0K
11.03%
jan 1, 1991
-600.0K
+910.0K
-60.26%
jan 1, 1992
-1.08 mln
-480.0K
80.0%
jan 1, 1993
-1.06 mln
+20.0K
-1.85%
jan 1, 1994
-1.08 mln
-20.0K
1.89%
jan 1, 1995
-1.11 mln
-30.0K
2.78%
jan 1, 1996
-1.2 mln
-90.0K
8.11%
jan 1, 1997
1.88 mln
+3.08 mln
-256.67%
jan 1, 1998
3.58 mln
+1.7 mln
90.43%
jan 1, 1999
-1.2 mln
-4.78 mln
-133.52%
jan 1, 2000
3.57 mln
+4.77 mln
-397.5%
jan 1, 2001
1.42 mln
-2.15 mln
-60.22%
jan 1, 2002
4.55 mln
+3.13 mln
220.42%
jan 1, 2003
1.11 mln
-3.44 mln
-75.6%
jan 1, 2004
200.0K
-910.0K
-81.98%
jan 1, 2005
380.0K
+180.0K
90.0%
jan 1, 2006
-1.63 mln
-2.01 mln
-528.95%
jan 1, 2008
-250.0K
+1.38 mln
-84.66%
jan 1, 2009
7.26 mln
+7.51 mln
-3.0K%
jan 1, 2010
420.0K
-6.84 mln
-94.21%
jan 1, 2011
2.66 mln
+2.24 mln
533.33%
jan 1, 2012
2.04 mln
-620.0K
-23.31%
jan 1, 2013
-1.75 mln
-3.79 mln
-185.78%
jan 1, 2014
880.0K
+2.63 mln
-150.29%
jan 1, 2015
2.07 mln
+1.19 mln
135.23%
Ranking of countries by current statistics by years


Comments: