29
/
en
AIzaSyAYiBZKx7MnpbEhh9jyipgxe19OcubqV5w
April 1, 2024
243940
Solomon Islands
SLB
true
2
1
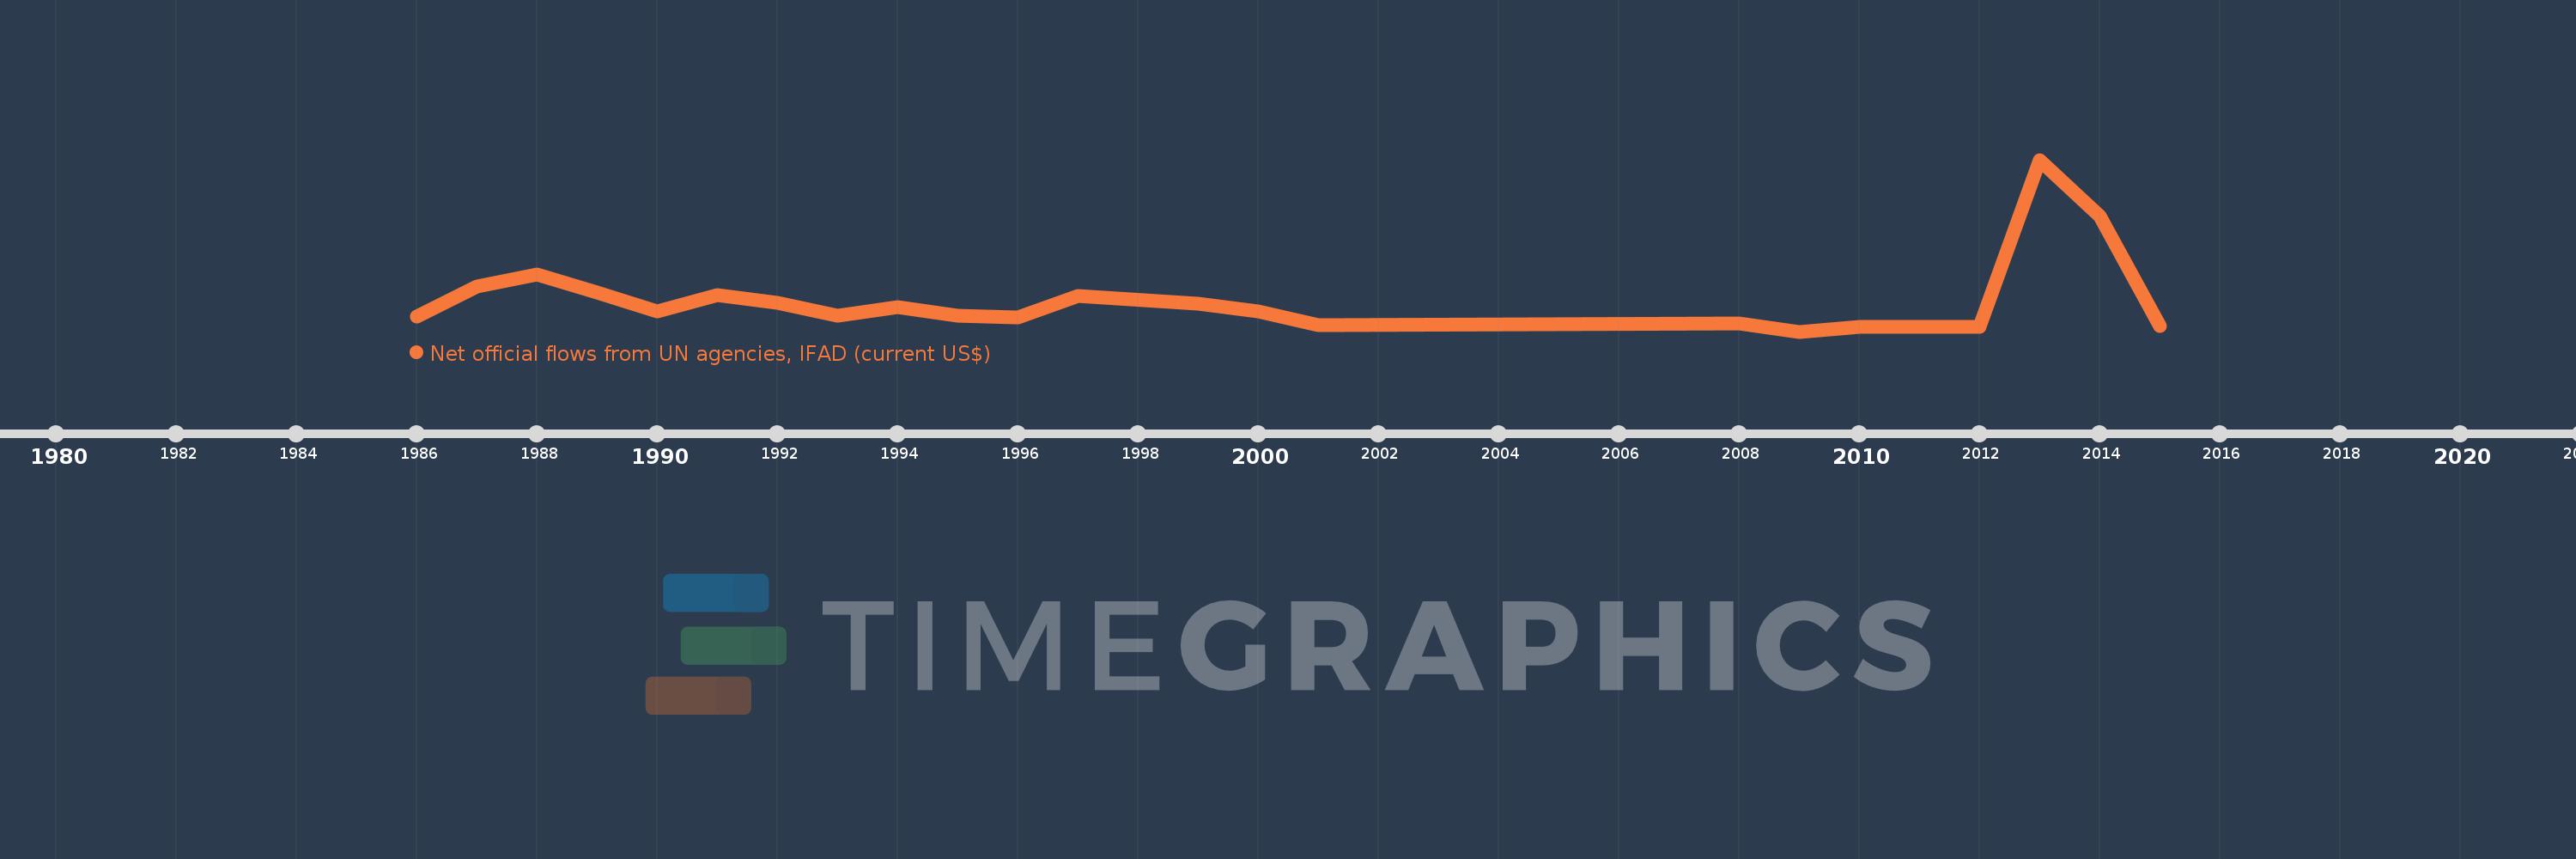
Net official flows from UN agencies, IFAD (current US$)
2015,2014,2013,2012,2011,2010,2009,2008,2001,2000,1999,1997,1996,1995,1994,1993,1992,1991,1990,1989,1988,1987,1986
This statistics in other country:
Timeline:
This timeline shows a graph from 1986 to 2015 of Solomon Islands. No data until 1985. Number of actual observations by date: 23.
Source name:
World Development Indicators
Source organization:
Development Assistance Committee of the Organisation for Economic Co-operation and Development, Geographical Distribution of Financial Flows to Developing Countries, Development Co-operation Report, and International Development Statistics database. Data are available online at: www.oecd.org/dac/stats/idsonline.
Categories, topics:
Aid Effectiveness
Last updated:
apr 23, 2017
Indicators value changes by year
Minimum:
-170.0K
jan 1, 2009
Maximum:
2.26 mln
jan 1, 2013
At the date of observation
Value
Absolute change
Change from previous value
jan 1, 1986
40.0K
+40.0K
0.0%
jan 1, 1987
470.0K
+430.0K
1.07K%
jan 1, 1988
640.0K
+170.0K
36.17%
jan 1, 1989
380.0K
-260.0K
-40.63%
jan 1, 1990
120.0K
-260.0K
-68.42%
jan 1, 1991
350.0K
+230.0K
191.67%
jan 1, 1992
240.0K
-110.0K
-31.43%
jan 1, 1993
50.0K
-190.0K
-79.17%
jan 1, 1994
180.0K
+130.0K
260.0%
jan 1, 1995
50.0K
-130.0K
-72.22%
jan 1, 1996
30.0K
-20.0K
-40.0%
jan 1, 1997
340.0K
+310.0K
1.03K%
jan 1, 1999
230.0K
-110.0K
-32.35%
jan 1, 2000
120.0K
-110.0K
-47.83%
jan 1, 2001
-80.0K
-200.0K
-166.67%
jan 1, 2008
-50.0K
+30.0K
-37.5%
jan 1, 2009
-170.0K
-120.0K
240.0%
jan 1, 2010
-100.0K
+70.0K
-41.18%
jan 1, 2011
-100.0K
0.0
0.0%
jan 1, 2012
-100.0K
0.0
0.0%
jan 1, 2013
2.26 mln
+2.36 mln
-2.36K%
jan 1, 2014
1.46 mln
-800.0K
-35.4%
jan 1, 2015
-90.0K
-1.55 mln
-106.16%
Ranking of countries by current statistics by years


Comments: