29
/
en
AIzaSyAYiBZKx7MnpbEhh9jyipgxe19OcubqV5w
April 1, 2024
46417
Low income
LIC
false
2
1
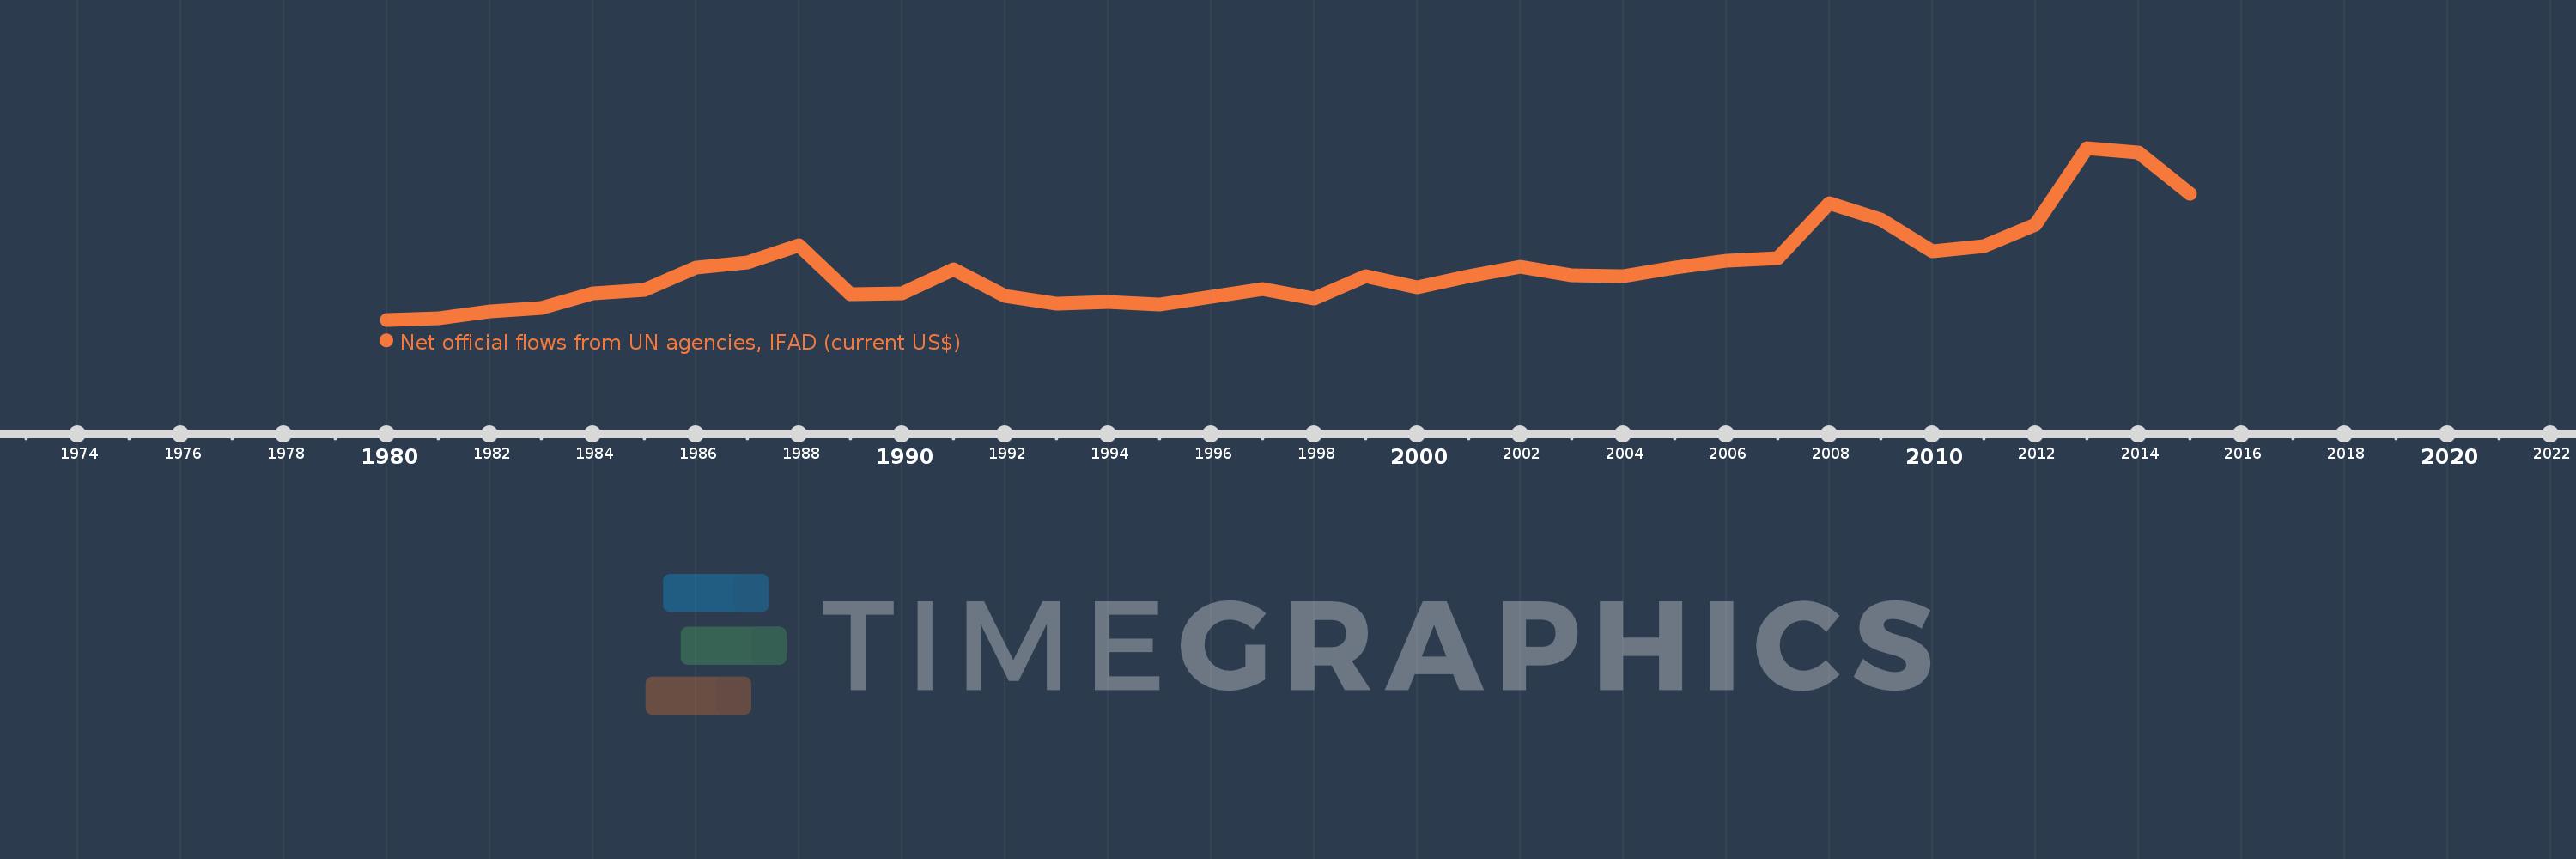
Net official flows from UN agencies, IFAD (current US$)
2015,2014,2013,2012,2011,2010,2009,2008,2007,2006,2005,2004,2003,2002,2001,2000,1999,1998,1997,1996,1995,1994,1993,1992,1991,1990,1989,1988,1987,1986,1985,1984,1983,1982,1981,1980
This statistics in other country:
Timeline:
This timeline shows a graph from 1980 to 2015 of Low income. No data until 1979. Number of actual observations by date: 36.
Source name:
World Development Indicators
Source organization:
Development Assistance Committee of the Organisation for Economic Co-operation and Development, Geographical Distribution of Financial Flows to Developing Countries, Development Co-operation Report, and International Development Statistics database. Data are available online at: www.oecd.org/dac/stats/idsonline.
Categories, topics:
Aid Effectiveness
Last updated:
apr 23, 2017
Indicators value changes by year
Minimum:
900.0K
jan 1, 1980
Maximum:
232.36 mln
jan 1, 2013
At the date of observation
Value
Absolute change
Change from previous value
jan 1, 1980
900.0K
+900.0K
0.0%
jan 1, 1981
2.82 mln
+1.92 mln
213.33%
jan 1, 1982
11.9 mln
+9.08 mln
321.99%
jan 1, 1983
16.99 mln
+5.09 mln
42.77%
jan 1, 1984
36.94 mln
+19.95 mln
117.42%
jan 1, 1985
40.48 mln
+3.54 mln
9.58%
jan 1, 1986
71.53 mln
+31.05 mln
76.7%
jan 1, 1987
78.11 mln
+6.58 mln
9.2%
jan 1, 1988
100.71 mln
+22.6 mln
28.93%
jan 1, 1989
35.27 mln
-65.44 mln
-64.98%
jan 1, 1990
36.69 mln
+1.42 mln
4.03%
jan 1, 1991
68.91 mln
+32.22 mln
87.82%
jan 1, 1992
33.17 mln
-35.74 mln
-51.86%
jan 1, 1993
22.3 mln
-10.87 mln
-32.77%
jan 1, 1994
24.98 mln
+2.68 mln
12.02%
jan 1, 1995
21.38 mln
-3.6 mln
-14.41%
jan 1, 1996
31.68 mln
+10.3 mln
48.18%
jan 1, 1997
41.65 mln
+9.97 mln
31.47%
jan 1, 1998
29.72 mln
-11.93 mln
-28.64%
jan 1, 1999
60.0 mln
+30.28 mln
101.88%
jan 1, 2000
44.28 mln
-15.72 mln
-26.2%
jan 1, 2001
59.41 mln
+15.13 mln
34.17%
jan 1, 2002
72.86 mln
+13.45 mln
22.64%
jan 1, 2003
60.68 mln
-12.18 mln
-16.72%
jan 1, 2004
59.13 mln
-1.55 mln
-2.55%
jan 1, 2005
71.26 mln
+12.13 mln
20.51%
jan 1, 2006
80.08 mln
+8.82 mln
12.38%
jan 1, 2007
83.52 mln
+3.44 mln
4.3%
jan 1, 2008
158.39 mln
+74.87 mln
89.64%
jan 1, 2009
135.97 mln
-22.42 mln
-14.15%
jan 1, 2010
92.95 mln
-43.02 mln
-31.64%
jan 1, 2011
99.94 mln
+6.99 mln
7.52%
jan 1, 2012
129.09 mln
+29.15 mln
29.17%
jan 1, 2013
232.36 mln
+103.27 mln
80.0%
jan 1, 2014
225.69 mln
-6.67 mln
-2.87%
jan 1, 2015
170.29 mln
-55.4 mln
-24.55%
Ranking of countries by current statistics by years


Comments: