29
/
en
AIzaSyAYiBZKx7MnpbEhh9jyipgxe19OcubqV5w
April 1, 2024
112657
Costa Rica
CRI
true
2
1
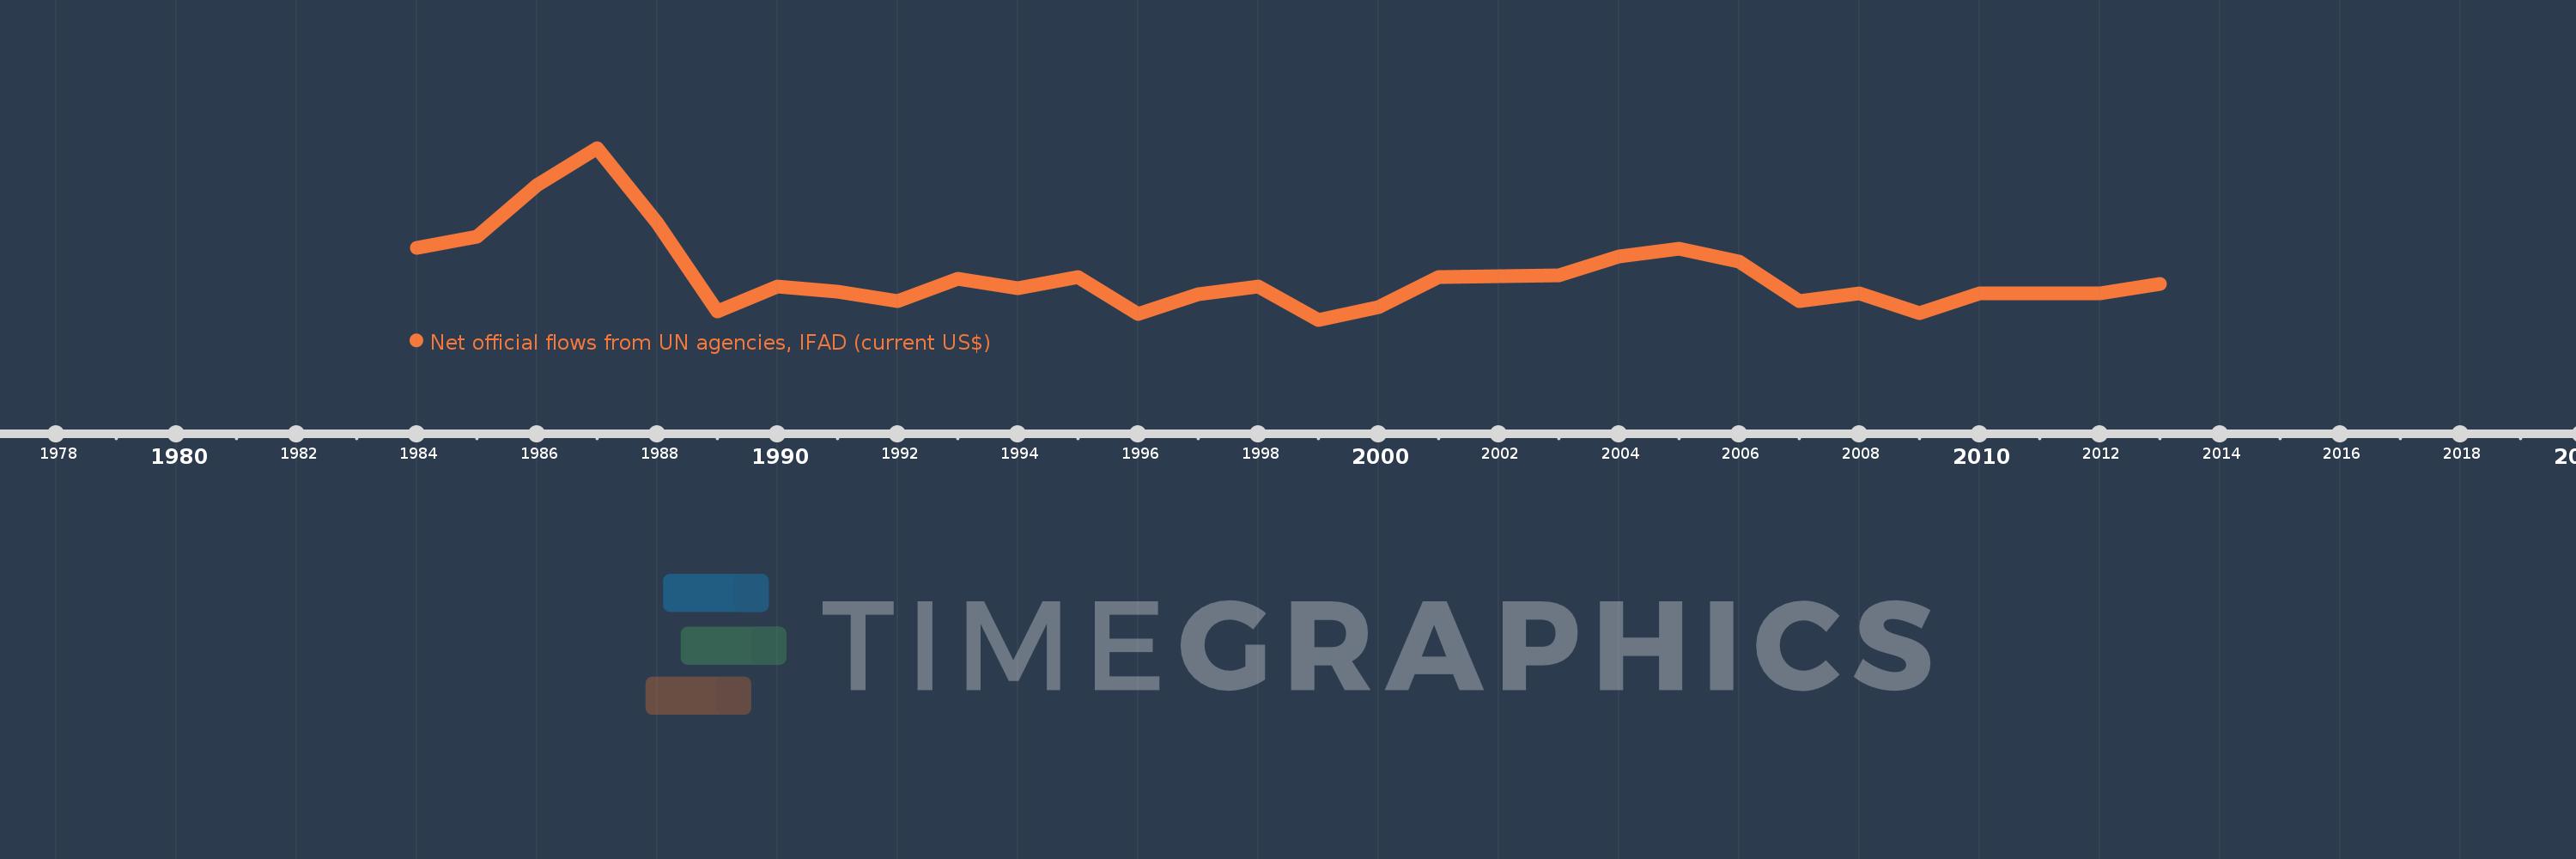
Net official flows from UN agencies, IFAD (current US$)
2013,2012,2011,2010,2009,2008,2007,2006,2005,2004,2003,2002,2001,2000,1999,1998,1997,1996,1995,1994,1993,1992,1991,1990,1989,1988,1987,1986,1985,1984
This statistics in other country:
Timeline:
This timeline shows a graph from 1984 to 2013 of Costa Rica. No data until 1983. Number of actual observations by date: 30.
Source name:
World Development Indicators
Source organization:
Development Assistance Committee of the Organisation for Economic Co-operation and Development, Geographical Distribution of Financial Flows to Developing Countries, Development Co-operation Report, and International Development Statistics database. Data are available online at: www.oecd.org/dac/stats/idsonline.
Categories, topics:
Aid Effectiveness
Last updated:
apr 23, 2017
Indicators value changes by year
Minimum:
-840.0K
jan 1, 1999
Maximum:
2.37 mln
jan 1, 1987
At the date of observation
Value
Absolute change
Change from previous value
jan 1, 1984
510.0K
+510.0K
0.0%
jan 1, 1985
720.0K
+210.0K
41.18%
jan 1, 1986
1.68 mln
+960.0K
133.33%
jan 1, 1987
2.37 mln
+690.0K
41.07%
jan 1, 1988
970.0K
-1.4 mln
-59.07%
jan 1, 1989
-680.0K
-1.65 mln
-170.1%
jan 1, 1990
-220.0K
+460.0K
-67.65%
jan 1, 1991
-320.0K
-100.0K
45.45%
jan 1, 1992
-490.0K
-170.0K
53.13%
jan 1, 1993
-70.0K
+420.0K
-85.71%
jan 1, 1994
-250.0K
-180.0K
257.14%
jan 1, 1995
-50.0K
+200.0K
-80.0%
jan 1, 1996
-740.0K
-690.0K
1.38K%
jan 1, 1997
-370.0K
+370.0K
-50.0%
jan 1, 1998
-220.0K
+150.0K
-40.54%
jan 1, 1999
-840.0K
-620.0K
281.82%
jan 1, 2000
-610.0K
+230.0K
-27.38%
jan 1, 2001
-50.0K
+560.0K
-91.8%
jan 1, 2002
-20.0K
+30.0K
-60.0%
jan 1, 2003
-10.0K
+10.0K
-50.0%
jan 1, 2004
350.0K
+360.0K
-3.6K%
jan 1, 2005
480.0K
+130.0K
37.14%
jan 1, 2006
250.0K
-230.0K
-47.92%
jan 1, 2007
-490.0K
-740.0K
-296.0%
jan 1, 2008
-350.0K
+140.0K
-28.57%
jan 1, 2009
-720.0K
-370.0K
105.71%
jan 1, 2010
-350.0K
+370.0K
-51.39%
jan 1, 2011
-340.0K
+10.0K
-2.86%
jan 1, 2012
-350.0K
-10.0K
2.94%
jan 1, 2013
-170.0K
+180.0K
-51.43%
Ranking of countries by current statistics by years


Comments: