29
/
en
AIzaSyAYiBZKx7MnpbEhh9jyipgxe19OcubqV5w
April 1, 2024
186908
Malawi
MWI
true
2
1
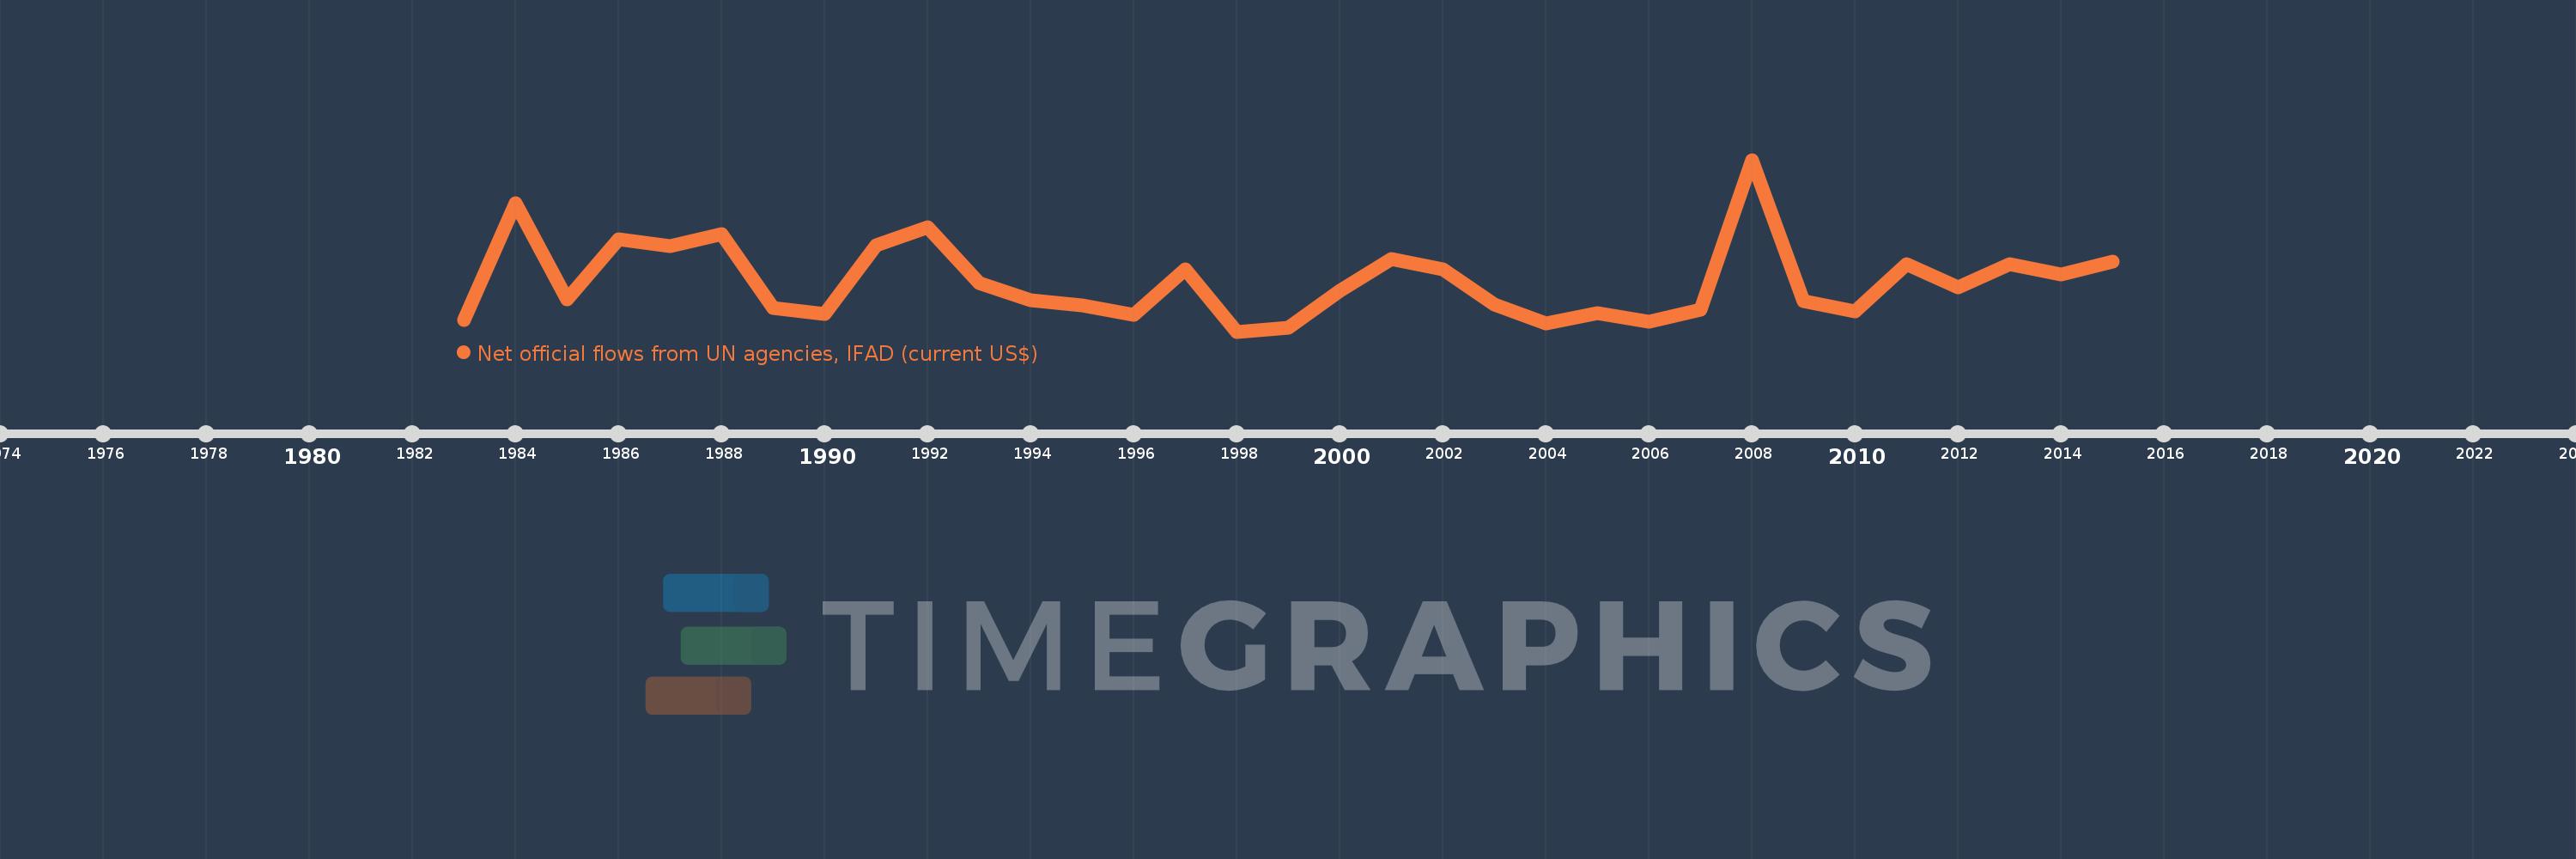
Net official flows from UN agencies, IFAD (current US$)
2015,2014,2013,2012,2011,2010,2009,2008,2007,2006,2005,2004,2003,2002,2001,2000,1999,1998,1997,1996,1995,1994,1993,1992,1991,1990,1989,1988,1987,1986,1985,1984,1983
This statistics in other country:
Timeline:
This timeline shows a graph from 1983 to 2015 of Malawi. No data until 1982. Number of actual observations by date: 33.
Source name:
World Development Indicators
Source organization:
Development Assistance Committee of the Organisation for Economic Co-operation and Development, Geographical Distribution of Financial Flows to Developing Countries, Development Co-operation Report, and International Development Statistics database. Data are available online at: www.oecd.org/dac/stats/idsonline.
Categories, topics:
Aid Effectiveness
Last updated:
apr 23, 2017
Indicators value changes by year
Minimum:
-200.0K
jan 1, 1998
Maximum:
9.82 mln
jan 1, 2008
At the date of observation
Value
Absolute change
Change from previous value
jan 1, 1983
490.0K
+490.0K
0.0%
jan 1, 1984
7.28 mln
+6.79 mln
1.39K%
jan 1, 1985
1.67 mln
-5.61 mln
-77.06%
jan 1, 1986
5.21 mln
+3.54 mln
211.98%
jan 1, 1987
4.76 mln
-450.0K
-8.64%
jan 1, 1988
5.48 mln
+720.0K
15.13%
jan 1, 1989
1.18 mln
-4.3 mln
-78.47%
jan 1, 1990
830.0K
-350.0K
-29.66%
jan 1, 1991
4.86 mln
+4.03 mln
485.54%
jan 1, 1992
5.87 mln
+1.01 mln
20.78%
jan 1, 1993
2.62 mln
-3.25 mln
-55.37%
jan 1, 1994
1.65 mln
-970.0K
-37.02%
jan 1, 1995
1.31 mln
-340.0K
-20.61%
jan 1, 1996
760.0K
-550.0K
-41.98%
jan 1, 1997
3.42 mln
+2.66 mln
350.0%
jan 1, 1998
-200.0K
-3.62 mln
-105.85%
jan 1, 1999
50.0K
+250.0K
-125.0%
jan 1, 2000
2.17 mln
+2.12 mln
4.24K%
jan 1, 2001
4.05 mln
+1.88 mln
86.64%
jan 1, 2002
3.45 mln
-600.0K
-14.81%
jan 1, 2003
1.39 mln
-2.06 mln
-59.71%
jan 1, 2004
300.0K
-1.09 mln
-78.42%
jan 1, 2005
880.0K
+580.0K
193.33%
jan 1, 2006
380.0K
-500.0K
-56.82%
jan 1, 2007
1.1 mln
+720.0K
189.47%
jan 1, 2008
9.82 mln
+8.72 mln
792.73%
jan 1, 2009
1.6 mln
-8.22 mln
-83.71%
jan 1, 2010
970.0K
-630.0K
-39.38%
jan 1, 2011
3.75 mln
+2.78 mln
286.6%
jan 1, 2012
2.39 mln
-1.36 mln
-36.27%
jan 1, 2013
3.72 mln
+1.33 mln
55.65%
jan 1, 2014
3.13 mln
-590.0K
-15.86%
jan 1, 2015
3.87 mln
+740.0K
23.64%
Ranking of countries by current statistics by years


Comments: