29
/
en
AIzaSyAYiBZKx7MnpbEhh9jyipgxe19OcubqV5w
April 1, 2024
116094
Cuba
CUB
true
2
1
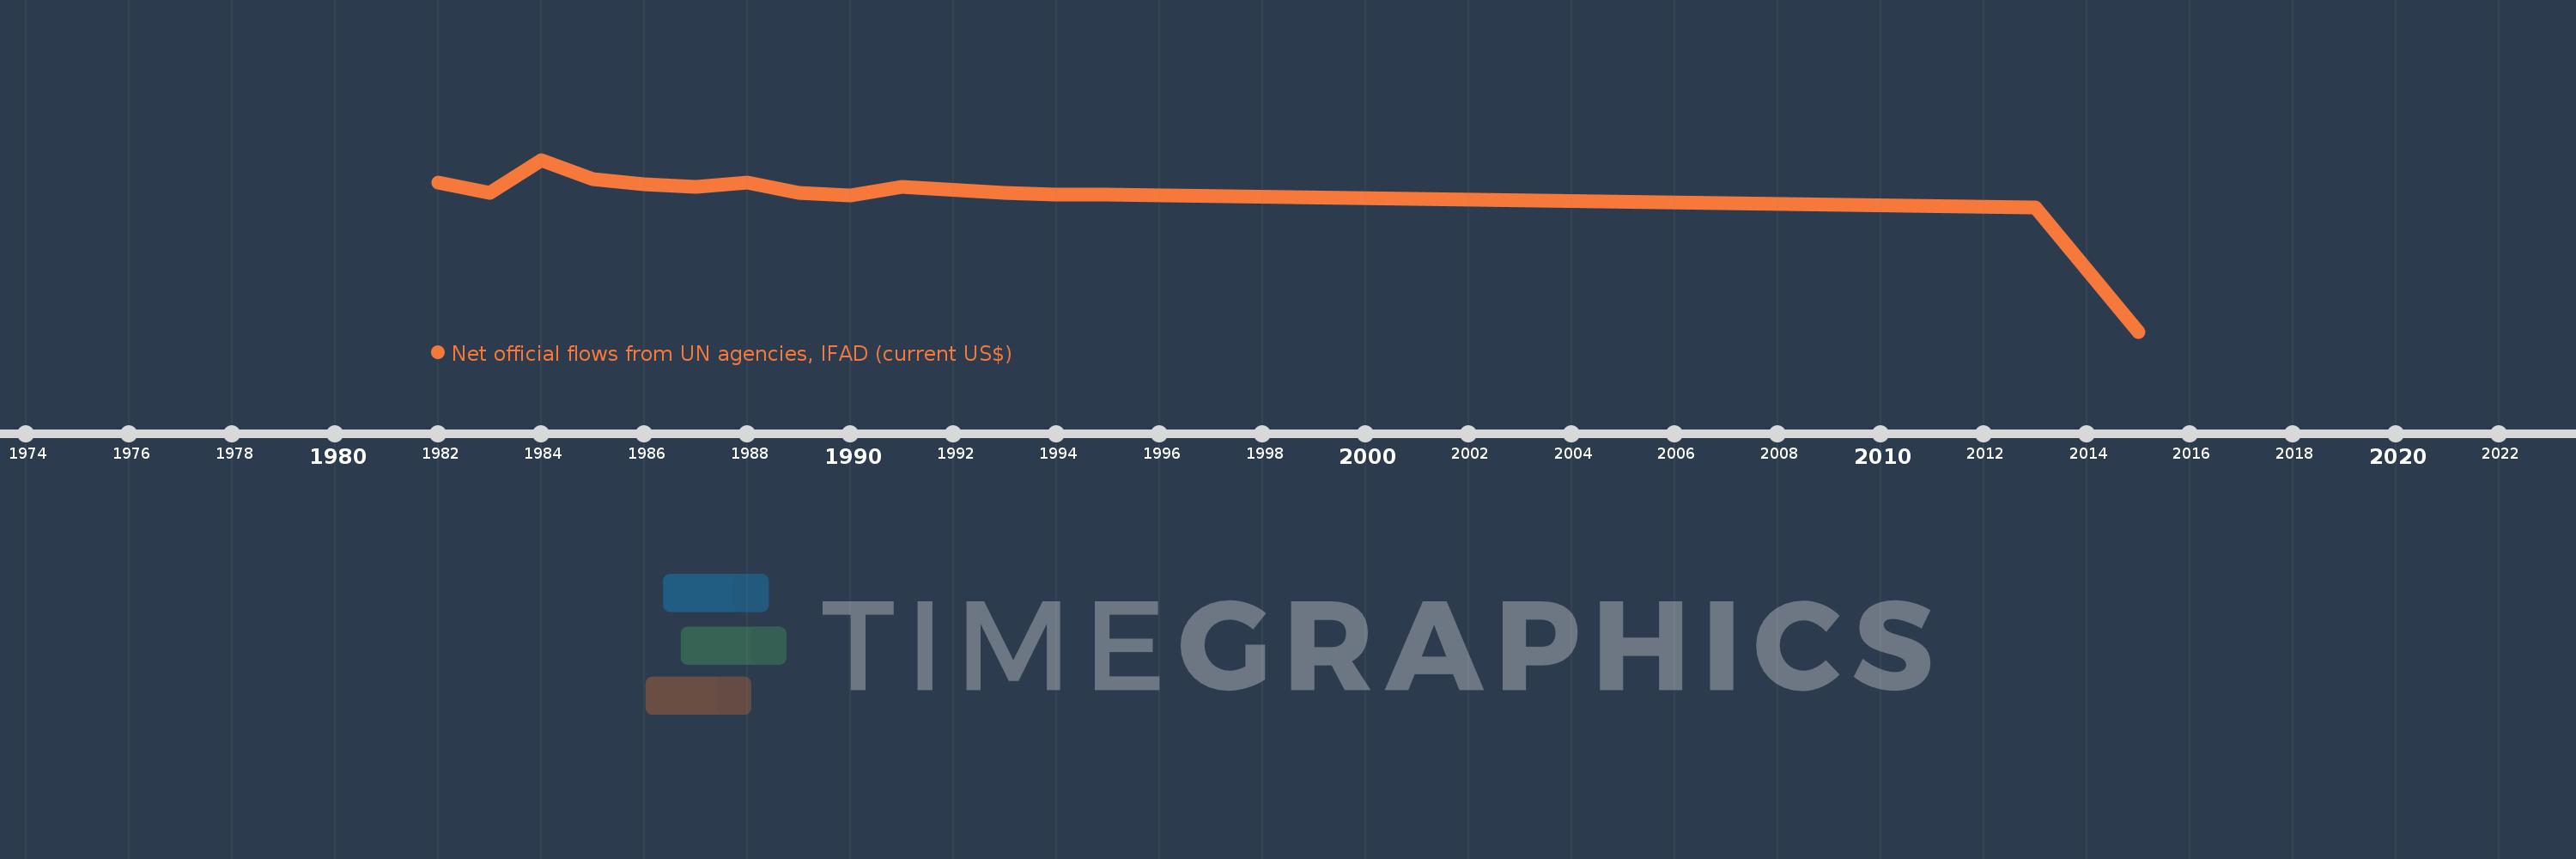
Net official flows from UN agencies, IFAD (current US$)
2015,2013,1995,1994,1993,1991,1990,1989,1988,1987,1986,1985,1984,1983,1982
This statistics in other country:
Timeline:
This timeline shows a graph from 1982 to 2015 of Cuba. No data until 1981. Number of actual observations by date: 15.
Source name:
World Development Indicators
Source organization:
Development Assistance Committee of the Organisation for Economic Co-operation and Development, Geographical Distribution of Financial Flows to Developing Countries, Development Co-operation Report, and International Development Statistics database. Data are available online at: www.oecd.org/dac/stats/idsonline.
Categories, topics:
Aid Effectiveness
Last updated:
apr 23, 2017
Indicators value changes by year
Minimum:
-15.42 mln
jan 1, 2015
Maximum:
3.92 mln
jan 1, 1984
At the date of observation
Value
Absolute change
Change from previous value
jan 1, 1982
1.32 mln
+1.32 mln
0.0%
jan 1, 1983
190.0K
-1.13 mln
-85.61%
jan 1, 1984
3.92 mln
+3.73 mln
1.96K%
jan 1, 1985
1.74 mln
-2.18 mln
-55.61%
jan 1, 1986
1.2 mln
-540.0K
-31.03%
jan 1, 1987
840.0K
-360.0K
-30.0%
jan 1, 1988
1.37 mln
+530.0K
63.1%
jan 1, 1989
240.0K
-1.13 mln
-82.48%
jan 1, 1990
-120.0K
-360.0K
-150.0%
jan 1, 1991
880.0K
+1000.0K
-833.33%
jan 1, 1993
230.0K
-650.0K
-73.86%
jan 1, 1994
0.0
-230.0K
-100.0%
jan 1, 2013
-1.44 mln
-1.44 mln
%
jan 1, 2015
-15.42 mln
-13.98 mln
970.83%
Ranking of countries by current statistics by years


Comments: