29
/
en
AIzaSyAYiBZKx7MnpbEhh9jyipgxe19OcubqV5w
April 1, 2024
102797
Central African Republic
CAF
true
2
1
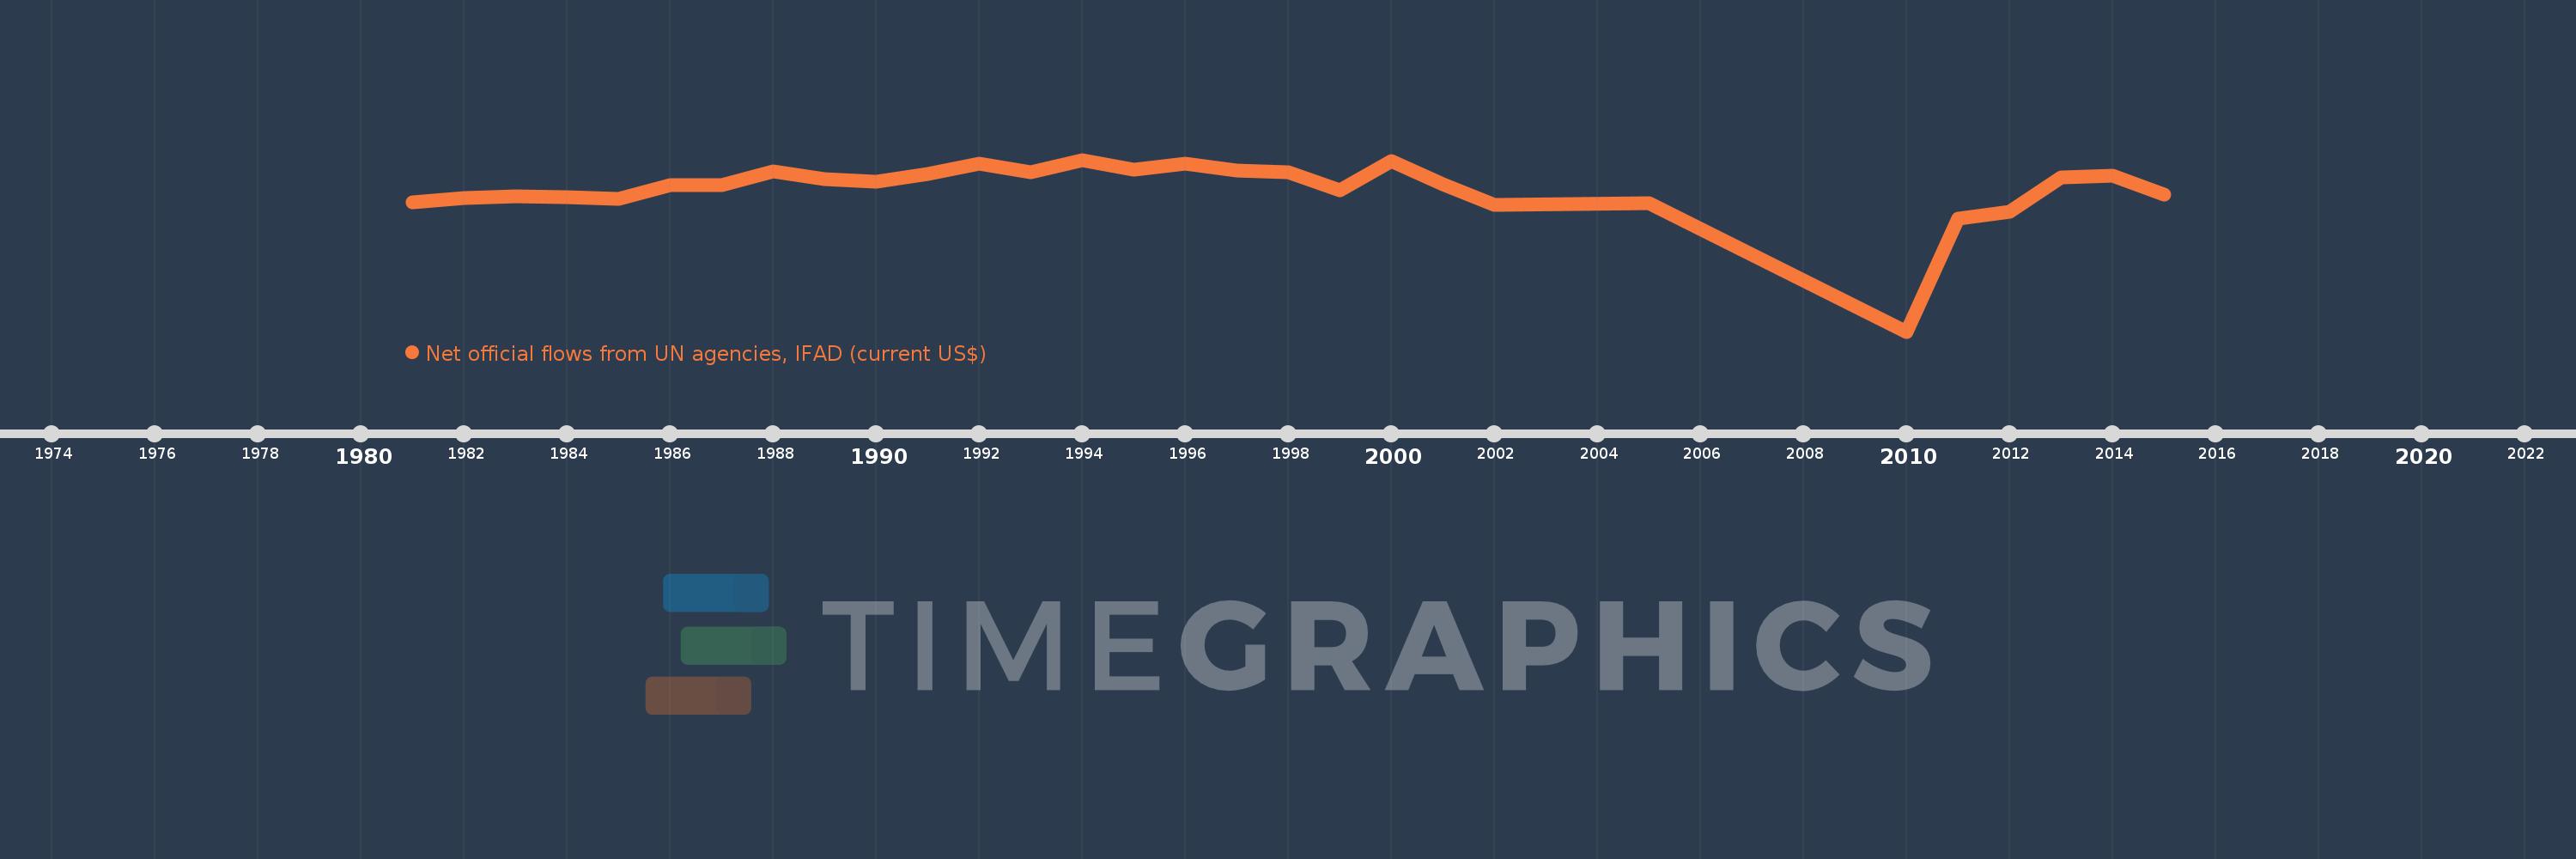
Net official flows from UN agencies, IFAD (current US$)
2015,2014,2013,2012,2011,2010,2005,2002,2001,2000,1999,1998,1997,1996,1995,1994,1993,1992,1991,1990,1989,1988,1987,1986,1985,1984,1983,1982,1981
This statistics in other country:
Timeline:
This timeline shows a graph from 1981 to 2015 of Central African Republic. No data until 1980. Number of actual observations by date: 29.
Source name:
World Development Indicators
Source organization:
Development Assistance Committee of the Organisation for Economic Co-operation and Development, Geographical Distribution of Financial Flows to Developing Countries, Development Co-operation Report, and International Development Statistics database. Data are available online at: www.oecd.org/dac/stats/idsonline.
Categories, topics:
Aid Effectiveness
Last updated:
apr 23, 2017
Indicators value changes by year
Minimum:
-7.73 mln
jan 1, 2010
Maximum:
2.64 mln
jan 1, 1994
At the date of observation
Value
Absolute change
Change from previous value
jan 1, 1981
80.0K
+80.0K
0.0%
jan 1, 1982
350.0K
+270.0K
337.5%
jan 1, 1983
420.0K
+70.0K
20.0%
jan 1, 1984
370.0K
-50.0K
-11.9%
jan 1, 1985
280.0K
-90.0K
-24.32%
jan 1, 1986
1.13 mln
+850.0K
303.57%
jan 1, 1987
1.13 mln
0.0
0.0%
jan 1, 1988
1.95 mln
+820.0K
72.57%
jan 1, 1989
1.48 mln
-470.0K
-24.1%
jan 1, 1990
1.3 mln
-180.0K
-12.16%
jan 1, 1991
1.8 mln
+500.0K
38.46%
jan 1, 1992
2.42 mln
+620.0K
34.44%
jan 1, 1993
1.9 mln
-520.0K
-21.49%
jan 1, 1994
2.64 mln
+740.0K
38.95%
jan 1, 1995
2.05 mln
-590.0K
-22.35%
jan 1, 1996
2.41 mln
+360.0K
17.56%
jan 1, 1997
2.0 mln
-410.0K
-17.01%
jan 1, 1998
1.9 mln
-100.0K
-5.0%
jan 1, 1999
790.0K
-1.11 mln
-58.42%
jan 1, 2000
2.58 mln
+1.79 mln
226.58%
jan 1, 2001
1.18 mln
-1.4 mln
-54.26%
jan 1, 2002
-60.0K
-1.24 mln
-105.08%
jan 1, 2005
20.0K
+80.0K
-133.33%
jan 1, 2010
-7.73 mln
-7.75 mln
-38.75K%
jan 1, 2011
-900.0K
+6.83 mln
-88.36%
jan 1, 2012
-500.0K
+400.0K
-44.44%
jan 1, 2013
1.6 mln
+2.1 mln
-420.0%
jan 1, 2014
1.67 mln
+70.0K
4.37%
jan 1, 2015
540.0K
-1.13 mln
-67.66%
Ranking of countries by current statistics by years


Comments: