29
/
en
AIzaSyAYiBZKx7MnpbEhh9jyipgxe19OcubqV5w
April 1, 2024
138431
Georgia
GEO
true
2
1
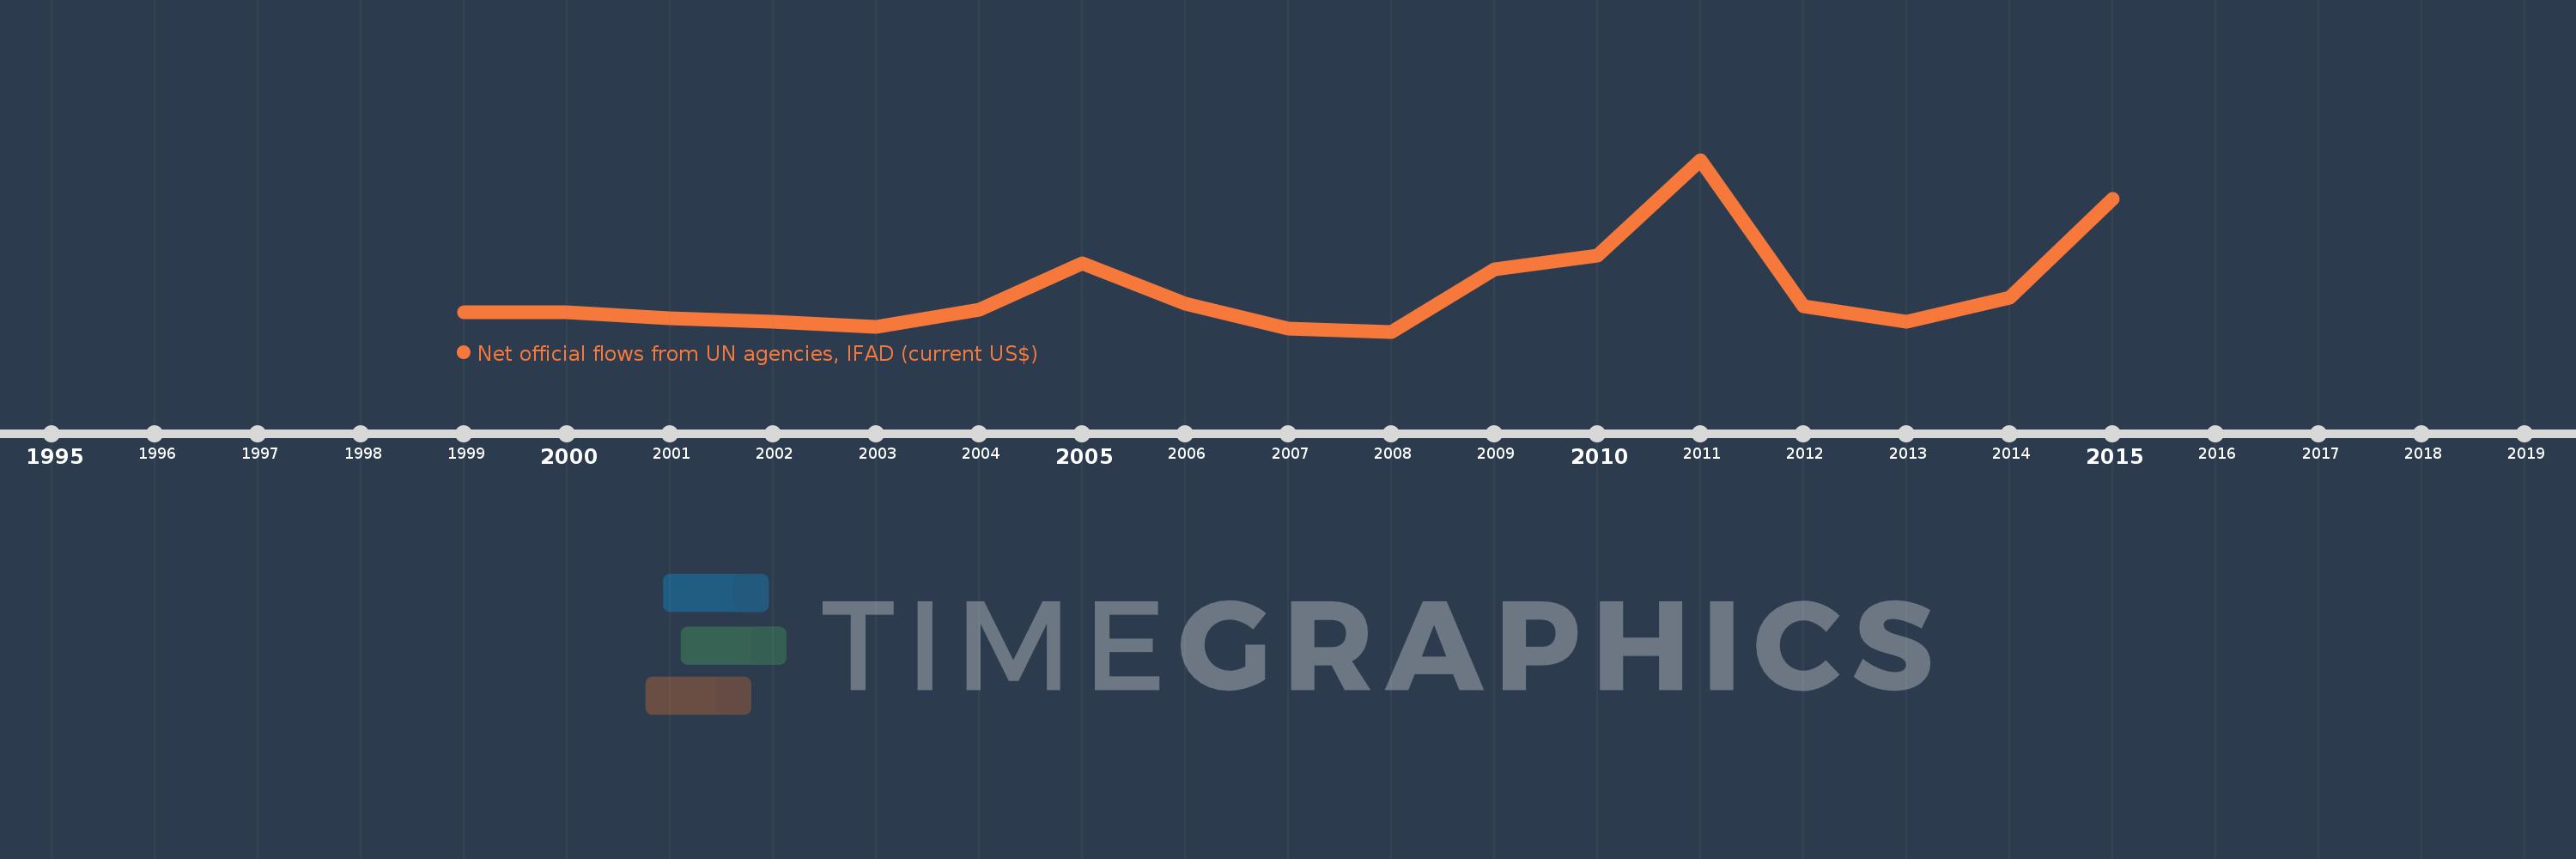
Net official flows from UN agencies, IFAD (current US$)
2015,2014,2013,2012,2011,2010,2009,2008,2007,2006,2005,2004,2003,2002,2001,2000,1999
This statistics in other country:
Timeline:
This timeline shows a graph from 1999 to 2015 of Georgia. No data until 1998. Number of actual observations by date: 17.
Source name:
World Development Indicators
Source organization:
Development Assistance Committee of the Organisation for Economic Co-operation and Development, Geographical Distribution of Financial Flows to Developing Countries, Development Co-operation Report, and International Development Statistics database. Data are available online at: www.oecd.org/dac/stats/idsonline.
Categories, topics:
Aid Effectiveness
Last updated:
apr 23, 2017
Indicators value changes by year
Minimum:
420.0K
jan 1, 2008
Maximum:
6.62 mln
jan 1, 2011
At the date of observation
Value
Absolute change
Change from previous value
jan 1, 1999
1.11 mln
+1.11 mln
0.0%
jan 1, 2000
1.13 mln
+20.0K
1.8%
jan 1, 2001
910.0K
-220.0K
-19.47%
jan 1, 2002
790.0K
-120.0K
-13.19%
jan 1, 2003
580.0K
-210.0K
-26.58%
jan 1, 2004
1.2 mln
+620.0K
106.9%
jan 1, 2005
2.88 mln
+1.68 mln
140.0%
jan 1, 2006
1.43 mln
-1.45 mln
-50.35%
jan 1, 2007
540.0K
-890.0K
-62.24%
jan 1, 2008
420.0K
-120.0K
-22.22%
jan 1, 2009
2.66 mln
+2.24 mln
533.33%
jan 1, 2010
3.15 mln
+490.0K
18.42%
jan 1, 2011
6.62 mln
+3.47 mln
110.16%
jan 1, 2012
1.35 mln
-5.27 mln
-79.61%
jan 1, 2013
770.0K
-580.0K
-42.96%
jan 1, 2014
1.65 mln
+880.0K
114.29%
jan 1, 2015
5.2 mln
+3.55 mln
215.15%
Ranking of countries by current statistics by years


Comments: