29
/
en
AIzaSyAYiBZKx7MnpbEhh9jyipgxe19OcubqV5w
April 1, 2024
70209
Argentina
ARG
true
2
1
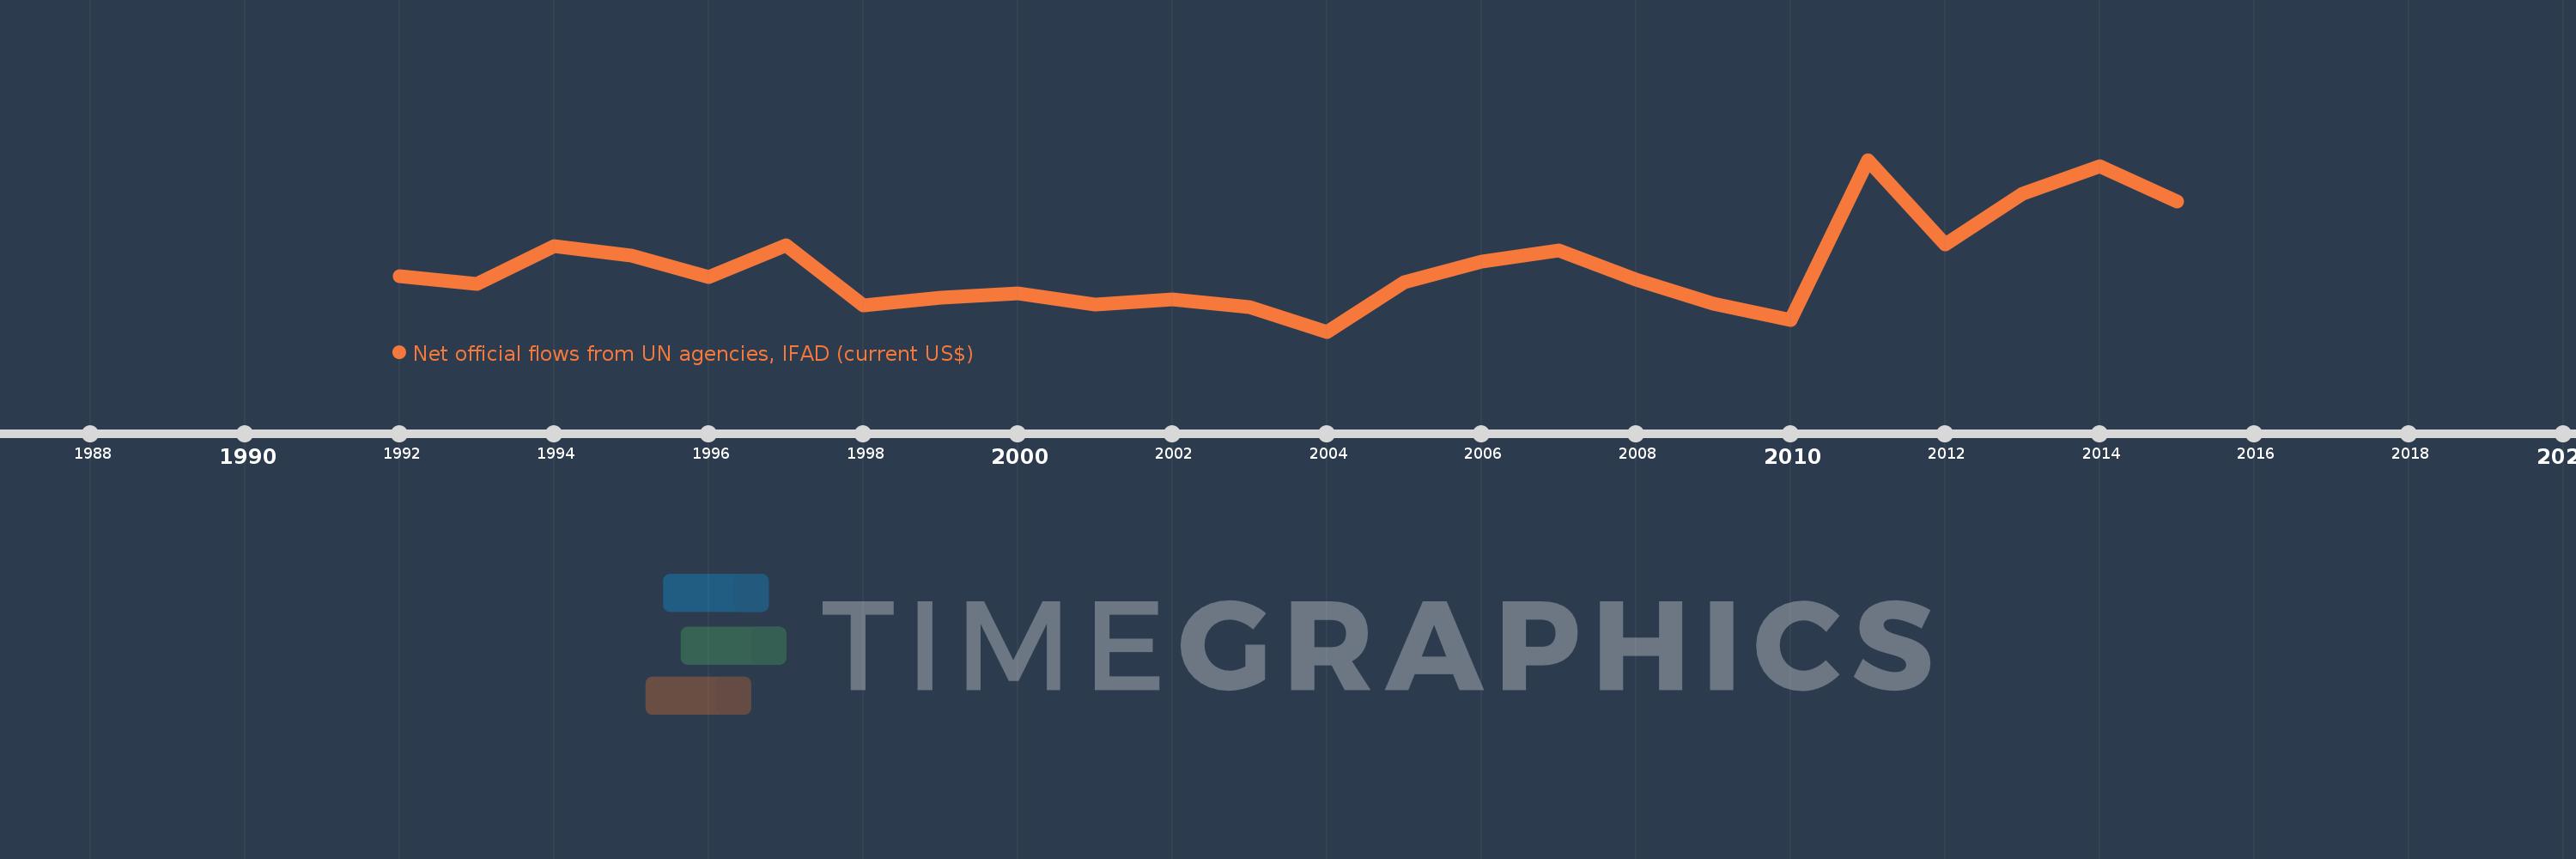
Net official flows from UN agencies, IFAD (current US$)
2015,2014,2013,2012,2011,2010,2009,2008,2007,2006,2005,2004,2003,2002,2001,2000,1999,1998,1997,1996,1995,1994,1993,1992
This statistics in other country:
Timeline:
This timeline shows a graph from 1992 to 2015 of Argentina. No data until 1991. Number of actual observations by date: 24.
Source name:
World Development Indicators
Source organization:
Development Assistance Committee of the Organisation for Economic Co-operation and Development, Geographical Distribution of Financial Flows to Developing Countries, Development Co-operation Report, and International Development Statistics database. Data are available online at: www.oecd.org/dac/stats/idsonline.
Categories, topics:
Aid Effectiveness
Last updated:
apr 23, 2017
Indicators value changes by year
Minimum:
-2.27 mln
jan 1, 2004
Maximum:
7.26 mln
jan 1, 2011
At the date of observation
Value
Absolute change
Change from previous value
jan 1, 1992
810.0K
+810.0K
0.0%
jan 1, 1993
380.0K
-430.0K
-53.09%
jan 1, 1994
2.45 mln
+2.07 mln
544.74%
jan 1, 1995
1.96 mln
-490.0K
-20.0%
jan 1, 1996
770.0K
-1.19 mln
-60.71%
jan 1, 1997
2.51 mln
+1.74 mln
225.97%
jan 1, 1998
-840.0K
-3.35 mln
-133.47%
jan 1, 1999
-410.0K
+430.0K
-51.19%
jan 1, 2000
-130.0K
+280.0K
-68.29%
jan 1, 2001
-770.0K
-640.0K
492.31%
jan 1, 2002
-480.0K
+290.0K
-37.66%
jan 1, 2003
-900.0K
-420.0K
87.5%
jan 1, 2004
-2.27 mln
-1.37 mln
152.22%
jan 1, 2005
470.0K
+2.74 mln
-120.7%
jan 1, 2006
1.61 mln
+1.14 mln
242.55%
jan 1, 2007
2.23 mln
+620.0K
38.51%
jan 1, 2008
610.0K
-1.62 mln
-72.65%
jan 1, 2009
-730.0K
-1.34 mln
-219.67%
jan 1, 2010
-1.62 mln
-890.0K
121.92%
jan 1, 2011
7.26 mln
+8.88 mln
-548.15%
jan 1, 2012
2.58 mln
-4.68 mln
-64.46%
jan 1, 2013
5.38 mln
+2.8 mln
108.53%
jan 1, 2014
6.92 mln
+1.54 mln
28.62%
jan 1, 2015
4.93 mln
-1.99 mln
-28.76%
Ranking of countries by current statistics by years


Comments: