29
/
en
AIzaSyAYiBZKx7MnpbEhh9jyipgxe19OcubqV5w
April 1, 2024
58318
South Asia (IDA & IBRD)
TSA
false
2
1
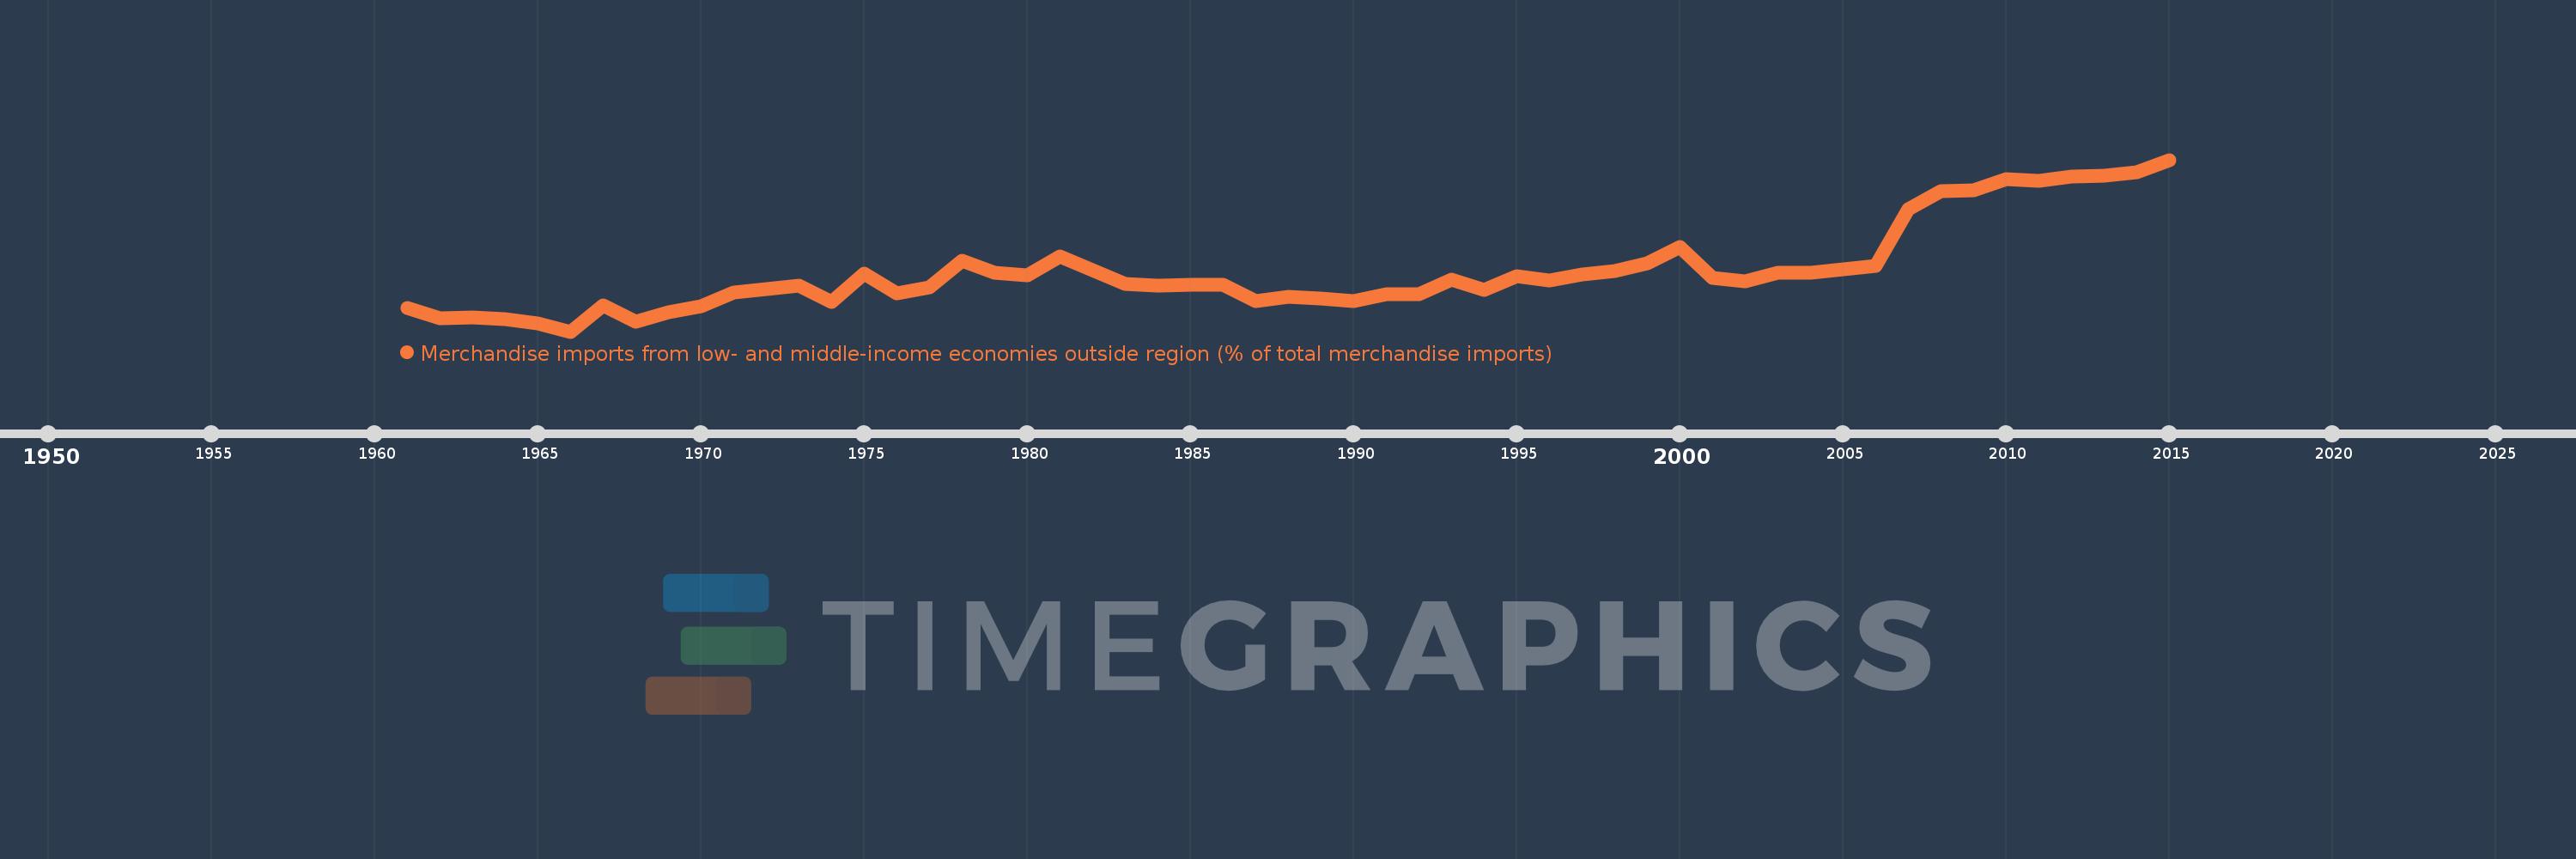
Merchandise imports from low- and middle-income economies outside region (% of total merchandise imports)
2015,2014,2013,2012,2011,2010,2009,2008,2007,2006,2005,2004,2003,2002,2001,2000,1999,1998,1997,1996,1995,1994,1993,1992,1991,1990,1989,1988,1987,1986,1985,1984,1983,1982,1981,1980,1979,1978,1977,1976,1975,1974,1973,1972,1971,1970,1969,1968,1967,1966,1965,1964,1963,1962,1961
This statistics in other country:
AfghanistanAlbaniaAlgeriaAngolaArab WorldArgentinaArmeniaArubaAustraliaAustriaAzerbaijanBahamas, TheBahrainBangladeshBarbadosBelarusBelgiumBelizeBeninBermudaBoliviaBrazilBrunei DarussalamBulgariaBurkina FasoBurundiCabo VerdeCambodiaCameroonCanadaCaribbean small statesCentral African RepublicCentral Europe and the BalticsChileChinaColombiaCongo, Dem. Rep.Congo, Rep.Costa RicaCote d'IvoireCroatiaCubaCyprusCzech RepublicDenmarkDominicaDominican RepublicEarly-demographic dividendEast Asia & PacificEast Asia & Pacific (excluding high income)East Asia & Pacific (IDA & IBRD countries)EcuadorEgypt, Arab Rep.El SalvadorEstoniaEthiopiaEuro areaEurope & Central AsiaEurope & Central Asia (excluding high income)Europe & Central Asia (IDA & IBRD countries)European UnionFijiFinlandFragile and conflict affected situationsFranceGabonGambia, TheGeorgiaGermanyGhanaGreeceGreenlandGrenadaGuatemalaGuineaGuyanaHaitiHeavily indebted poor countries (HIPC)High incomeHondurasHong Kong SAR, ChinaHungaryIBRD onlyIcelandIDA & IBRD totalIDA blendIDA onlyIDA totalIndiaIndonesiaIran, Islamic Rep.IraqIrelandIsraelItalyJamaicaJapanJordanKazakhstanKenyaKorea, Dem. People’s Rep.Korea, Rep.KuwaitKyrgyz RepublicLao PDRLate-demographic dividendLatin America & Caribbean Latin America & Caribbean (excluding high income)Latin America & the Caribbean (IDA & IBRD countries)LatviaLeast developed countries: UN classificationLebanonLiberiaLibyaLithuaniaLow & middle incomeLow incomeLower middle incomeLuxembourgMacao SAR, ChinaMacedonia, FYRMadagascarMalawiMalaysiaMaliMaltaMauritaniaMauritiusMexicoMiddle East & North AfricaMiddle East & North Africa (excluding high income)Middle East & North Africa (IDA & IBRD countries)Middle incomeMoldovaMongoliaMontenegroMoroccoMozambiqueMyanmarNetherlandsNew CaledoniaNew ZealandNicaraguaNigerNigeriaNorth AmericaNorwayOECD membersOmanOther small statesPacific island small statesPakistanPanamaPapua New GuineaParaguayPeruPhilippinesPolandPortugalPost-demographic dividendPre-demographic dividendQatarRomaniaRussian FederationRwandaSaudi ArabiaSenegalSerbiaSeychellesSierra LeoneSingaporeSlovak RepublicSloveniaSmall statesSomaliaSouth AfricaSouth AsiaSouth Asia (IDA & IBRD)SpainSri LankaSt. Kitts and NevisSt. LuciaSt. Vincent and the GrenadinesSub-Saharan Africa Sub-Saharan Africa (excluding high income)Sub-Saharan Africa (IDA & IBRD countries)SudanSurinameSwedenSwitzerlandSyrian Arab RepublicTanzaniaThailandTogoTrinidad and TobagoTunisiaTurkeyUgandaUkraineUnited Arab EmiratesUnited KingdomUnited StatesUpper middle incomeUruguayVenezuela, RBVietnamWorldYemen, Rep.ZambiaZimbabwe Timeline:
This timeline shows a graph from 1961 to 2015 of South Asia (IDA & IBRD). No data until 1960. Number of actual observations by date: 55.
Source name:
World Development Indicators
Source organization:
World Bank staff estimates based data from International Monetary Fund's Direction of Trade database.
Categories, topics:
Private Sector, Trade
Last updated:
apr 23, 2017
Indicators value changes by year
Maximum:
38.722
jan 1, 2015
At the date of observation
Value
Absolute change
Change from previous value
jan 1, 1961
12.45
+12.45
0.0%
jan 1, 1962
10.633
-1.818
-14.6%
jan 1, 1963
10.831
+0.198
1.87%
jan 1, 1964
10.394
-0.437
-4.04%
jan 1, 1965
9.675
-0.718
-6.91%
jan 1, 1966
8.248
-1.428
-14.76%
jan 1, 1967
12.887
+4.639
56.25%
jan 1, 1968
10.043
-2.844
-22.07%
jan 1, 1969
11.64
+1.597
15.9%
jan 1, 1970
12.766
+1.126
9.67%
jan 1, 1971
15.19
+2.424
18.99%
jan 1, 1972
15.844
+0.654
4.31%
jan 1, 1973
16.43
+0.586
3.7%
jan 1, 1974
13.512
-2.918
-17.76%
jan 1, 1975
18.575
+5.063
37.47%
jan 1, 1976
15.065
-3.51
-18.9%
jan 1, 1977
16.023
+0.958
6.36%
jan 1, 1978
20.805
+4.781
29.84%
jan 1, 1979
18.658
-2.147
-10.32%
jan 1, 1980
18.256
-0.401
-2.15%
jan 1, 1981
21.633
+3.377
18.5%
jan 1, 1982
19.199
-2.435
-11.26%
jan 1, 1983
16.662
-2.536
-13.21%
jan 1, 1984
16.327
-0.335
-2.01%
jan 1, 1985
16.51
+0.182
1.12%
jan 1, 1986
16.594
+0.084
0.51%
jan 1, 1987
13.707
-2.886
-17.39%
jan 1, 1988
14.371
+0.664
4.84%
jan 1, 1989
14.104
-0.266
-1.85%
jan 1, 1990
13.584
-0.521
-3.69%
jan 1, 1991
14.823
+1.24
9.13%
jan 1, 1992
14.852
+0.029
0.19%
jan 1, 1993
17.418
+2.566
17.28%
jan 1, 1994
15.649
-1.769
-10.16%
jan 1, 1995
18.125
+2.477
15.83%
jan 1, 1996
17.294
-0.832
-4.59%
jan 1, 1997
18.353
+1.06
6.13%
jan 1, 1998
18.93
+0.577
3.14%
jan 1, 1999
20.39
+1.459
7.71%
jan 1, 2000
23.316
+2.926
14.35%
jan 1, 2001
17.789
-5.526
-23.7%
jan 1, 2002
17.19
-0.599
-3.37%
jan 1, 2003
18.613
+1.423
8.28%
jan 1, 2004
18.706
+0.093
0.5%
jan 1, 2005
19.323
+0.617
3.3%
jan 1, 2006
19.902
+0.579
3.0%
jan 1, 2007
30.005
+10.104
50.77%
jan 1, 2008
33.113
+3.107
10.36%
jan 1, 2009
33.338
+0.226
0.68%
jan 1, 2010
35.241
+1.902
5.71%
jan 1, 2011
34.934
-0.307
-0.87%
jan 1, 2012
35.804
+0.87
2.49%
jan 1, 2013
35.968
+0.164
0.46%
jan 1, 2014
36.521
+0.554
1.54%
jan 1, 2015
38.722
+2.201
6.03%
Ranking of countries by current statistics by years


Comments: