29
/
en
AIzaSyAYiBZKx7MnpbEhh9jyipgxe19OcubqV5w
April 1, 2024
52825
OECD members
OED
false
2
1
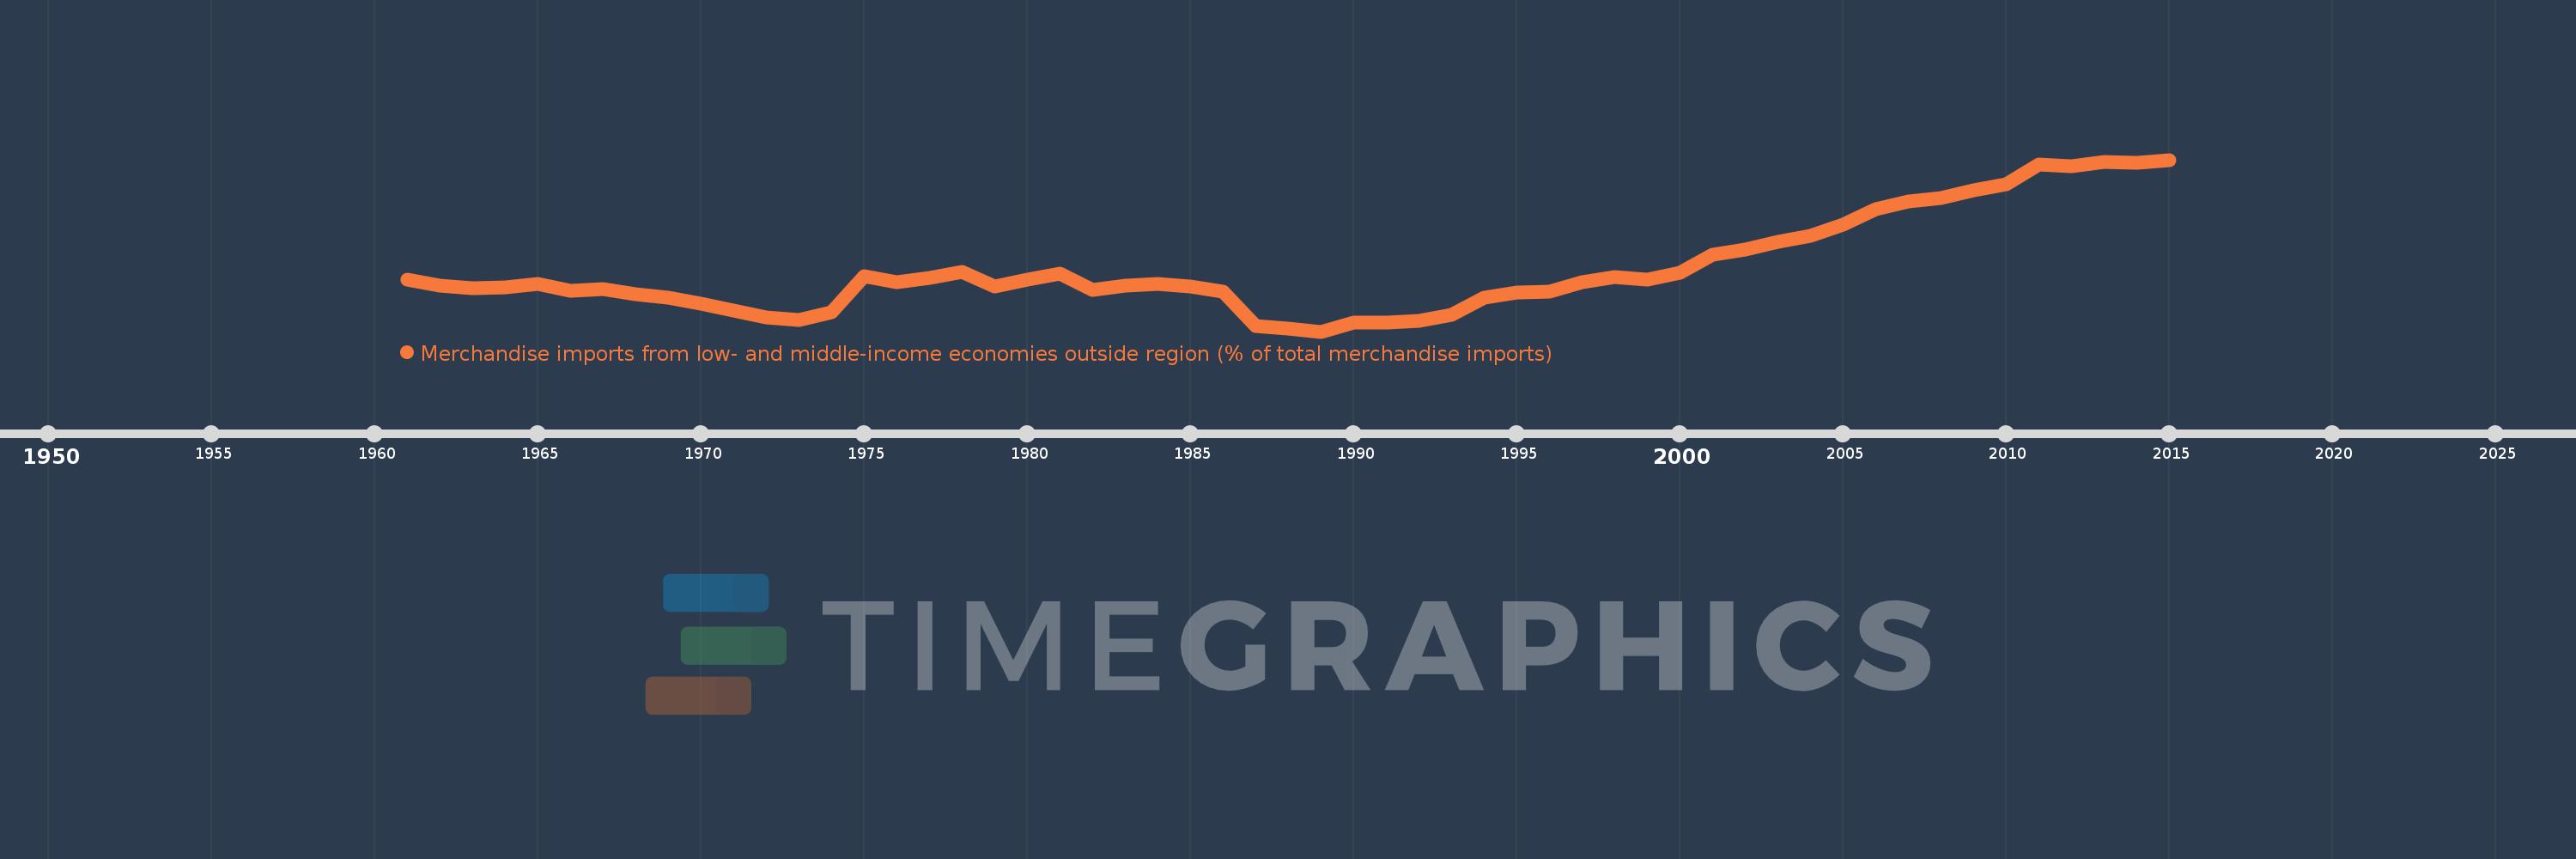
Merchandise imports from low- and middle-income economies outside region (% of total merchandise imports)
2015,2014,2013,2012,2011,2010,2009,2008,2007,2006,2005,2004,2003,2002,2001,2000,1999,1998,1997,1996,1995,1994,1993,1992,1991,1990,1989,1988,1987,1986,1985,1984,1983,1982,1981,1980,1979,1978,1977,1976,1975,1974,1973,1972,1971,1970,1969,1968,1967,1966,1965,1964,1963,1962,1961
This statistics in other country:
AfghanistanAlbaniaAlgeriaAngolaArab WorldArgentinaArmeniaArubaAustraliaAustriaAzerbaijanBahamas, TheBahrainBangladeshBarbadosBelarusBelgiumBelizeBeninBermudaBoliviaBrazilBrunei DarussalamBulgariaBurkina FasoBurundiCabo VerdeCambodiaCameroonCanadaCaribbean small statesCentral African RepublicCentral Europe and the BalticsChileChinaColombiaCongo, Dem. Rep.Congo, Rep.Costa RicaCote d'IvoireCroatiaCubaCyprusCzech RepublicDenmarkDominicaDominican RepublicEarly-demographic dividendEast Asia & PacificEast Asia & Pacific (excluding high income)East Asia & Pacific (IDA & IBRD countries)EcuadorEgypt, Arab Rep.El SalvadorEstoniaEthiopiaEuro areaEurope & Central AsiaEurope & Central Asia (excluding high income)Europe & Central Asia (IDA & IBRD countries)European UnionFijiFinlandFragile and conflict affected situationsFranceGabonGambia, TheGeorgiaGermanyGhanaGreeceGreenlandGrenadaGuatemalaGuineaGuyanaHaitiHeavily indebted poor countries (HIPC)High incomeHondurasHong Kong SAR, ChinaHungaryIBRD onlyIcelandIDA & IBRD totalIDA blendIDA onlyIDA totalIndiaIndonesiaIran, Islamic Rep.IraqIrelandIsraelItalyJamaicaJapanJordanKazakhstanKenyaKorea, Dem. People’s Rep.Korea, Rep.KuwaitKyrgyz RepublicLao PDRLate-demographic dividendLatin America & Caribbean Latin America & Caribbean (excluding high income)Latin America & the Caribbean (IDA & IBRD countries)LatviaLeast developed countries: UN classificationLebanonLiberiaLibyaLithuaniaLow & middle incomeLow incomeLower middle incomeLuxembourgMacao SAR, ChinaMacedonia, FYRMadagascarMalawiMalaysiaMaliMaltaMauritaniaMauritiusMexicoMiddle East & North AfricaMiddle East & North Africa (excluding high income)Middle East & North Africa (IDA & IBRD countries)Middle incomeMoldovaMongoliaMontenegroMoroccoMozambiqueMyanmarNetherlandsNew CaledoniaNew ZealandNicaraguaNigerNigeriaNorth AmericaNorwayOECD membersOmanOther small statesPacific island small statesPakistanPanamaPapua New GuineaParaguayPeruPhilippinesPolandPortugalPost-demographic dividendPre-demographic dividendQatarRomaniaRussian FederationRwandaSaudi ArabiaSenegalSerbiaSeychellesSierra LeoneSingaporeSlovak RepublicSloveniaSmall statesSomaliaSouth AfricaSouth AsiaSouth Asia (IDA & IBRD)SpainSri LankaSt. Kitts and NevisSt. LuciaSt. Vincent and the GrenadinesSub-Saharan Africa Sub-Saharan Africa (excluding high income)Sub-Saharan Africa (IDA & IBRD countries)SudanSurinameSwedenSwitzerlandSyrian Arab RepublicTanzaniaThailandTogoTrinidad and TobagoTunisiaTurkeyUgandaUkraineUnited Arab EmiratesUnited KingdomUnited StatesUpper middle incomeUruguayVenezuela, RBVietnamWorldYemen, Rep.ZambiaZimbabwe Timeline:
This timeline shows a graph from 1961 to 2015 of OECD members. No data until 1960. Number of actual observations by date: 55.
Source name:
World Development Indicators
Source organization:
World Bank staff estimates based data from International Monetary Fund's Direction of Trade database.
Categories, topics:
Private Sector, Trade
Last updated:
apr 23, 2017
Indicators value changes by year
Minimum:
12.293
jan 1, 1989
Maximum:
28.275
jan 1, 2015
At the date of observation
Value
Absolute change
Change from previous value
jan 1, 1961
17.106
+17.106
0.0%
jan 1, 1962
16.58
-0.526
-3.07%
jan 1, 1963
16.352
-0.227
-1.37%
jan 1, 1964
16.376
+0.024
0.14%
jan 1, 1965
16.714
+0.338
2.06%
jan 1, 1966
16.113
-0.601
-3.59%
jan 1, 1967
16.25
+0.137
0.85%
jan 1, 1968
15.781
-0.47
-2.89%
jan 1, 1969
15.412
-0.369
-2.34%
jan 1, 1970
14.862
-0.55
-3.57%
jan 1, 1971
14.212
-0.65
-4.37%
jan 1, 1972
13.618
-0.594
-4.18%
jan 1, 1973
13.408
-0.21
-1.54%
jan 1, 1974
14.082
+0.673
5.02%
jan 1, 1975
17.468
+3.386
24.05%
jan 1, 1976
16.888
-0.58
-3.32%
jan 1, 1977
17.267
+0.38
2.25%
jan 1, 1978
17.823
+0.555
3.22%
jan 1, 1979
16.521
-1.302
-7.3%
jan 1, 1980
17.162
+0.641
3.88%
jan 1, 1981
17.724
+0.562
3.28%
jan 1, 1982
16.135
-1.589
-8.96%
jan 1, 1983
16.545
+0.41
2.54%
jan 1, 1984
16.729
+0.183
1.11%
jan 1, 1985
16.521
-0.207
-1.24%
jan 1, 1986
15.998
-0.524
-3.17%
jan 1, 1987
12.784
-3.213
-20.09%
jan 1, 1988
12.608
-0.176
-1.38%
jan 1, 1989
12.293
-0.315
-2.5%
jan 1, 1990
13.097
+0.804
6.54%
jan 1, 1991
13.105
+0.007
0.06%
jan 1, 1992
13.329
+0.225
1.71%
jan 1, 1993
13.858
+0.529
3.97%
jan 1, 1994
15.424
+1.566
11.3%
jan 1, 1995
15.91
+0.486
3.15%
jan 1, 1996
16.04
+0.129
0.81%
jan 1, 1997
16.863
+0.824
5.13%
jan 1, 1998
17.352
+0.489
2.9%
jan 1, 1999
17.099
-0.254
-1.46%
jan 1, 2000
17.734
+0.635
3.71%
jan 1, 2001
19.41
+1.676
9.45%
jan 1, 2002
19.919
+0.509
2.62%
jan 1, 2003
20.649
+0.73
3.67%
jan 1, 2004
21.223
+0.574
2.78%
jan 1, 2005
22.21
+0.986
4.65%
jan 1, 2006
23.648
+1.438
6.48%
jan 1, 2007
24.388
+0.74
3.13%
jan 1, 2008
24.736
+0.348
1.43%
jan 1, 2009
25.41
+0.674
2.72%
jan 1, 2010
26.031
+0.621
2.44%
jan 1, 2011
27.854
+1.822
7.0%
jan 1, 2012
27.677
-0.177
-0.64%
jan 1, 2013
28.103
+0.427
1.54%
jan 1, 2014
27.974
-0.129
-0.46%
jan 1, 2015
28.275
+0.301
1.08%
Ranking of countries by current statistics by years


Comments: