29
/
en
AIzaSyAYiBZKx7MnpbEhh9jyipgxe19OcubqV5w
April 1, 2024
188088
Malaysia
MYS
true
2
1
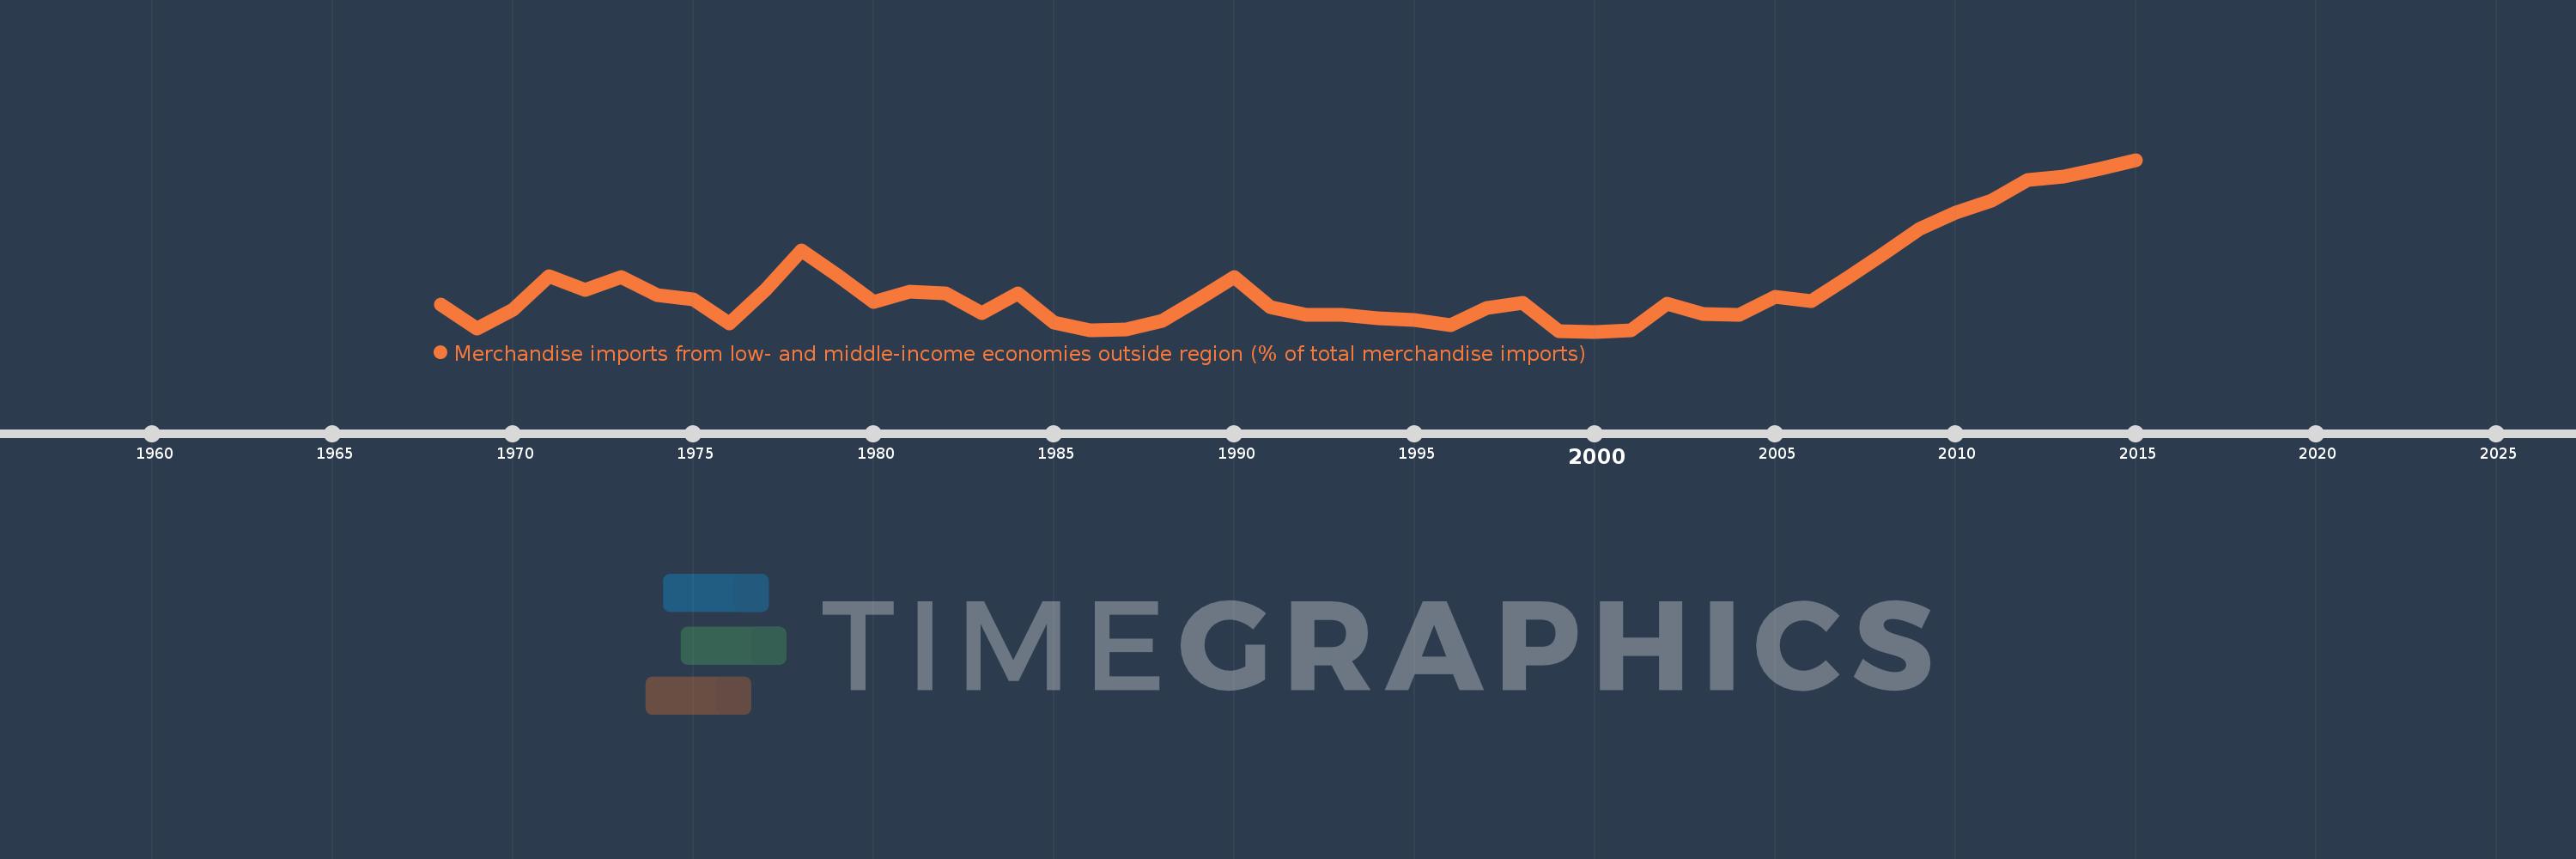
Merchandise imports from low- and middle-income economies outside region (% of total merchandise imports)
2015,2014,2013,2012,2011,2010,2009,2008,2007,2006,2005,2004,2003,2002,2001,2000,1999,1998,1997,1996,1995,1994,1993,1992,1991,1990,1989,1988,1987,1986,1985,1984,1983,1982,1981,1980,1979,1978,1977,1976,1975,1974,1973,1972,1971,1970,1969,1968
This statistics in other country:
AfghanistanAlbaniaAlgeriaAngolaArab WorldArgentinaArmeniaArubaAustraliaAustriaAzerbaijanBahamas, TheBahrainBangladeshBarbadosBelarusBelgiumBelizeBeninBermudaBoliviaBrazilBrunei DarussalamBulgariaBurkina FasoBurundiCabo VerdeCambodiaCameroonCanadaCaribbean small statesCentral African RepublicCentral Europe and the BalticsChileChinaColombiaCongo, Dem. Rep.Congo, Rep.Costa RicaCote d'IvoireCroatiaCubaCyprusCzech RepublicDenmarkDominicaDominican RepublicEarly-demographic dividendEast Asia & PacificEast Asia & Pacific (excluding high income)East Asia & Pacific (IDA & IBRD countries)EcuadorEgypt, Arab Rep.El SalvadorEstoniaEthiopiaEuro areaEurope & Central AsiaEurope & Central Asia (excluding high income)Europe & Central Asia (IDA & IBRD countries)European UnionFijiFinlandFragile and conflict affected situationsFranceGabonGambia, TheGeorgiaGermanyGhanaGreeceGreenlandGrenadaGuatemalaGuineaGuyanaHaitiHeavily indebted poor countries (HIPC)High incomeHondurasHong Kong SAR, ChinaHungaryIBRD onlyIcelandIDA & IBRD totalIDA blendIDA onlyIDA totalIndiaIndonesiaIran, Islamic Rep.IraqIrelandIsraelItalyJamaicaJapanJordanKazakhstanKenyaKorea, Dem. People’s Rep.Korea, Rep.KuwaitKyrgyz RepublicLao PDRLate-demographic dividendLatin America & Caribbean Latin America & Caribbean (excluding high income)Latin America & the Caribbean (IDA & IBRD countries)LatviaLeast developed countries: UN classificationLebanonLiberiaLibyaLithuaniaLow & middle incomeLow incomeLower middle incomeLuxembourgMacao SAR, ChinaMacedonia, FYRMadagascarMalawiMalaysiaMaliMaltaMauritaniaMauritiusMexicoMiddle East & North AfricaMiddle East & North Africa (excluding high income)Middle East & North Africa (IDA & IBRD countries)Middle incomeMoldovaMongoliaMontenegroMoroccoMozambiqueMyanmarNetherlandsNew CaledoniaNew ZealandNicaraguaNigerNigeriaNorth AmericaNorwayOECD membersOmanOther small statesPacific island small statesPakistanPanamaPapua New GuineaParaguayPeruPhilippinesPolandPortugalPost-demographic dividendPre-demographic dividendQatarRomaniaRussian FederationRwandaSaudi ArabiaSenegalSerbiaSeychellesSierra LeoneSingaporeSlovak RepublicSloveniaSmall statesSomaliaSouth AfricaSouth AsiaSouth Asia (IDA & IBRD)SpainSri LankaSt. Kitts and NevisSt. LuciaSt. Vincent and the GrenadinesSub-Saharan Africa Sub-Saharan Africa (excluding high income)Sub-Saharan Africa (IDA & IBRD countries)SudanSurinameSwedenSwitzerlandSyrian Arab RepublicTanzaniaThailandTogoTrinidad and TobagoTunisiaTurkeyUgandaUkraineUnited Arab EmiratesUnited KingdomUnited StatesUpper middle incomeUruguayVenezuela, RBVietnamWorldYemen, Rep.ZambiaZimbabwe Timeline:
This timeline shows a graph from 1968 to 2015 of Malaysia. No data until 1967. Number of actual observations by date: 48.
Source name:
World Development Indicators
Source organization:
World Bank staff estimates based data from International Monetary Fund's Direction of Trade database.
Categories, topics:
Private Sector, Trade
Last updated:
apr 23, 2017
Indicators value changes by year
At the date of observation
Value
Absolute change
Change from previous value
jan 1, 1968
2.968
+2.968
0.0%
jan 1, 1969
2.257
-0.712
-23.97%
jan 1, 1970
2.806
+0.549
24.33%
jan 1, 1971
3.781
+0.975
34.75%
jan 1, 1972
3.397
-0.384
-10.14%
jan 1, 1973
3.764
+0.367
10.8%
jan 1, 1974
3.23
-0.534
-14.19%
jan 1, 1975
3.116
-0.114
-3.52%
jan 1, 1976
2.42
-0.696
-22.35%
jan 1, 1977
3.402
+0.982
40.59%
jan 1, 1978
4.542
+1.14
33.5%
jan 1, 1979
3.809
-0.733
-16.15%
jan 1, 1980
3.042
-0.767
-20.14%
jan 1, 1981
3.336
+0.294
9.68%
jan 1, 1982
3.287
-0.049
-1.48%
jan 1, 1983
2.727
-0.559
-17.02%
jan 1, 1984
3.302
+0.575
21.08%
jan 1, 1985
2.45
-0.852
-25.79%
jan 1, 1986
2.215
-0.236
-9.61%
jan 1, 1987
2.252
+0.037
1.67%
jan 1, 1988
2.482
+0.23
10.21%
jan 1, 1989
3.124
+0.642
25.87%
jan 1, 1990
3.774
+0.651
20.83%
jan 1, 1991
2.904
-0.87
-23.06%
jan 1, 1992
2.66
-0.244
-8.4%
jan 1, 1993
2.678
+0.018
0.69%
jan 1, 1994
2.56
-0.119
-4.43%
jan 1, 1995
2.521
-0.039
-1.51%
jan 1, 1996
2.373
-0.148
-5.88%
jan 1, 1997
2.875
+0.502
21.15%
jan 1, 1998
3.027
+0.152
5.3%
jan 1, 1999
2.192
-0.835
-27.58%
jan 1, 2000
2.181
-0.011
-0.52%
jan 1, 2001
2.213
+0.032
1.45%
jan 1, 2002
2.991
+0.779
35.19%
jan 1, 2003
2.69
-0.301
-10.08%
jan 1, 2004
2.671
-0.019
-0.71%
jan 1, 2005
3.184
+0.514
19.23%
jan 1, 2006
3.063
-0.121
-3.81%
jan 1, 2007
3.745
+0.682
22.26%
jan 1, 2008
4.446
+0.702
18.73%
jan 1, 2009
5.153
+0.707
15.89%
jan 1, 2010
5.642
+0.489
9.49%
jan 1, 2011
5.975
+0.333
5.9%
jan 1, 2012
6.573
+0.598
10.01%
jan 1, 2013
6.678
+0.105
1.61%
jan 1, 2014
6.906
+0.228
3.41%
jan 1, 2015
7.168
+0.262
3.79%
Ranking of countries by current statistics by years


Comments: