29
/
en
AIzaSyAYiBZKx7MnpbEhh9jyipgxe19OcubqV5w
April 1, 2024
183145
Macao SAR, China
MAC
true
2
1
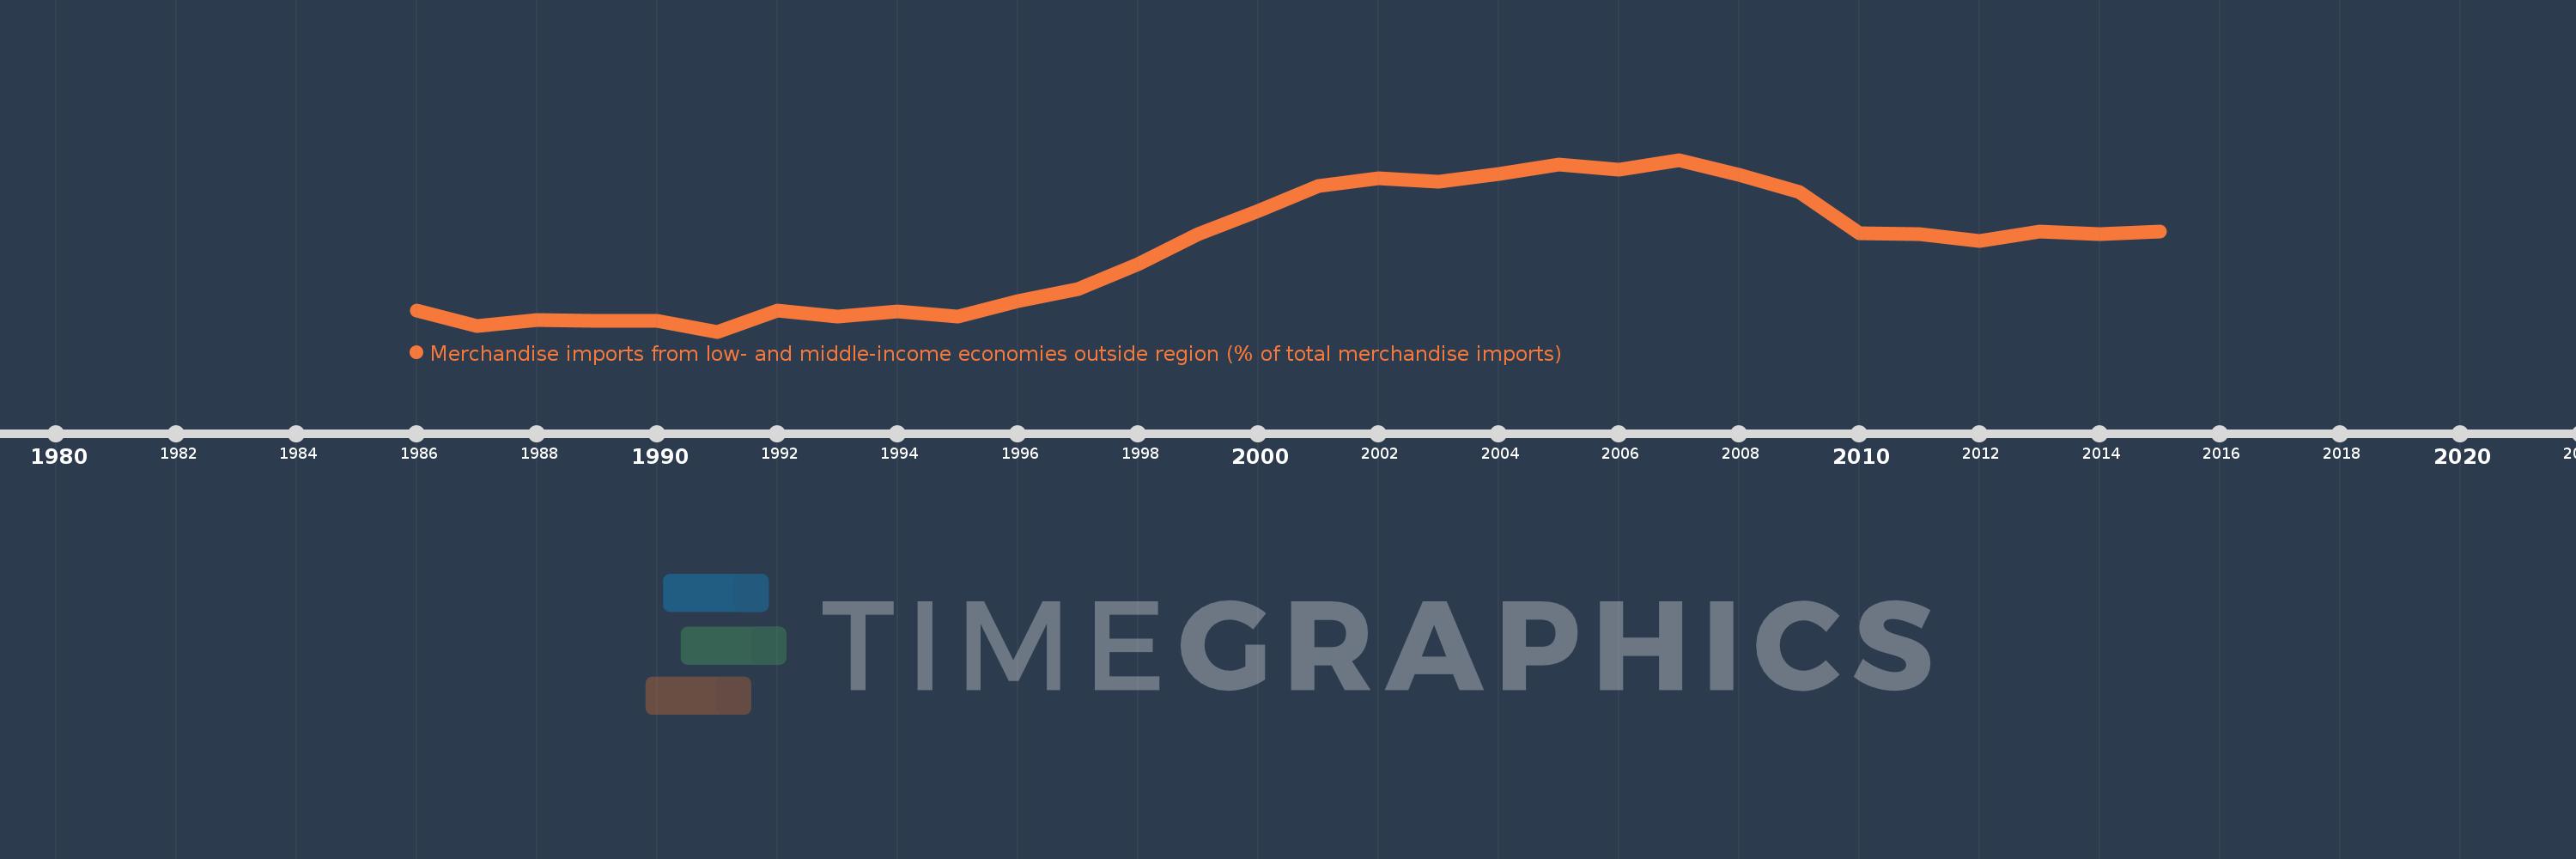
Merchandise imports from low- and middle-income economies outside region (% of total merchandise imports)
2015,2014,2013,2012,2011,2010,2009,2008,2007,2006,2005,2004,2003,2002,2001,2000,1999,1998,1997,1996,1995,1994,1993,1992,1991,1990,1989,1988,1987,1986
This statistics in other country:
AfghanistanAlbaniaAlgeriaAngolaArab WorldArgentinaArmeniaArubaAustraliaAustriaAzerbaijanBahamas, TheBahrainBangladeshBarbadosBelarusBelgiumBelizeBeninBermudaBoliviaBrazilBrunei DarussalamBulgariaBurkina FasoBurundiCabo VerdeCambodiaCameroonCanadaCaribbean small statesCentral African RepublicCentral Europe and the BalticsChileChinaColombiaCongo, Dem. Rep.Congo, Rep.Costa RicaCote d'IvoireCroatiaCubaCyprusCzech RepublicDenmarkDominicaDominican RepublicEarly-demographic dividendEast Asia & PacificEast Asia & Pacific (excluding high income)East Asia & Pacific (IDA & IBRD countries)EcuadorEgypt, Arab Rep.El SalvadorEstoniaEthiopiaEuro areaEurope & Central AsiaEurope & Central Asia (excluding high income)Europe & Central Asia (IDA & IBRD countries)European UnionFijiFinlandFragile and conflict affected situationsFranceGabonGambia, TheGeorgiaGermanyGhanaGreeceGreenlandGrenadaGuatemalaGuineaGuyanaHaitiHeavily indebted poor countries (HIPC)High incomeHondurasHong Kong SAR, ChinaHungaryIBRD onlyIcelandIDA & IBRD totalIDA blendIDA onlyIDA totalIndiaIndonesiaIran, Islamic Rep.IraqIrelandIsraelItalyJamaicaJapanJordanKazakhstanKenyaKorea, Dem. People’s Rep.Korea, Rep.KuwaitKyrgyz RepublicLao PDRLate-demographic dividendLatin America & Caribbean Latin America & Caribbean (excluding high income)Latin America & the Caribbean (IDA & IBRD countries)LatviaLeast developed countries: UN classificationLebanonLiberiaLibyaLithuaniaLow & middle incomeLow incomeLower middle incomeLuxembourgMacao SAR, ChinaMacedonia, FYRMadagascarMalawiMalaysiaMaliMaltaMauritaniaMauritiusMexicoMiddle East & North AfricaMiddle East & North Africa (excluding high income)Middle East & North Africa (IDA & IBRD countries)Middle incomeMoldovaMongoliaMontenegroMoroccoMozambiqueMyanmarNetherlandsNew CaledoniaNew ZealandNicaraguaNigerNigeriaNorth AmericaNorwayOECD membersOmanOther small statesPacific island small statesPakistanPanamaPapua New GuineaParaguayPeruPhilippinesPolandPortugalPost-demographic dividendPre-demographic dividendQatarRomaniaRussian FederationRwandaSaudi ArabiaSenegalSerbiaSeychellesSierra LeoneSingaporeSlovak RepublicSloveniaSmall statesSomaliaSouth AfricaSouth AsiaSouth Asia (IDA & IBRD)SpainSri LankaSt. Kitts and NevisSt. LuciaSt. Vincent and the GrenadinesSub-Saharan Africa Sub-Saharan Africa (excluding high income)Sub-Saharan Africa (IDA & IBRD countries)SudanSurinameSwedenSwitzerlandSyrian Arab RepublicTanzaniaThailandTogoTrinidad and TobagoTunisiaTurkeyUgandaUkraineUnited Arab EmiratesUnited KingdomUnited StatesUpper middle incomeUruguayVenezuela, RBVietnamWorldYemen, Rep.ZambiaZimbabwe Timeline:
This timeline shows a graph from 1986 to 2015 of Macao SAR, China. No data until 1985. Number of actual observations by date: 30.
Source name:
World Development Indicators
Source organization:
World Bank staff estimates based data from International Monetary Fund's Direction of Trade database.
Categories, topics:
Private Sector, Trade
Last updated:
apr 23, 2017
Indicators value changes by year
Minimum:
19.776
jan 1, 1991
Maximum:
49.402
jan 1, 2007
At the date of observation
Value
Absolute change
Change from previous value
jan 1, 1986
23.442
+23.442
0.0%
jan 1, 1987
20.709
-2.733
-11.66%
jan 1, 1988
21.779
+1.07
5.17%
jan 1, 1989
21.561
-0.218
-1.0%
jan 1, 1990
21.647
+0.086
0.4%
jan 1, 1991
19.776
-1.871
-8.64%
jan 1, 1992
23.416
+3.64
18.41%
jan 1, 1993
22.388
-1.028
-4.39%
jan 1, 1994
23.25
+0.862
3.85%
jan 1, 1995
22.388
-0.862
-3.71%
jan 1, 1996
25.066
+2.678
11.96%
jan 1, 1997
27.133
+2.067
8.25%
jan 1, 1998
31.456
+4.323
15.93%
jan 1, 1999
36.559
+5.102
16.22%
jan 1, 2000
40.561
+4.002
10.95%
jan 1, 2001
44.911
+4.35
10.72%
jan 1, 2002
46.223
+1.312
2.92%
jan 1, 2003
45.629
-0.595
-1.29%
jan 1, 2004
46.963
+1.335
2.93%
jan 1, 2005
48.516
+1.553
3.31%
jan 1, 2006
47.734
-0.783
-1.61%
jan 1, 2007
49.402
+1.669
3.5%
jan 1, 2008
46.777
-2.626
-5.31%
jan 1, 2009
43.909
-2.868
-6.13%
jan 1, 2010
36.762
-7.146
-16.28%
jan 1, 2011
36.597
-0.166
-0.45%
jan 1, 2012
35.423
-1.174
-3.21%
jan 1, 2013
37.012
+1.589
4.48%
jan 1, 2014
36.614
-0.398
-1.07%
jan 1, 2015
37.044
+0.43
1.17%
Ranking of countries by current statistics by years


Comments: