29
/
en
AIzaSyAYiBZKx7MnpbEhh9jyipgxe19OcubqV5w
April 1, 2024
40110
IDA total
IDA
false
2
1
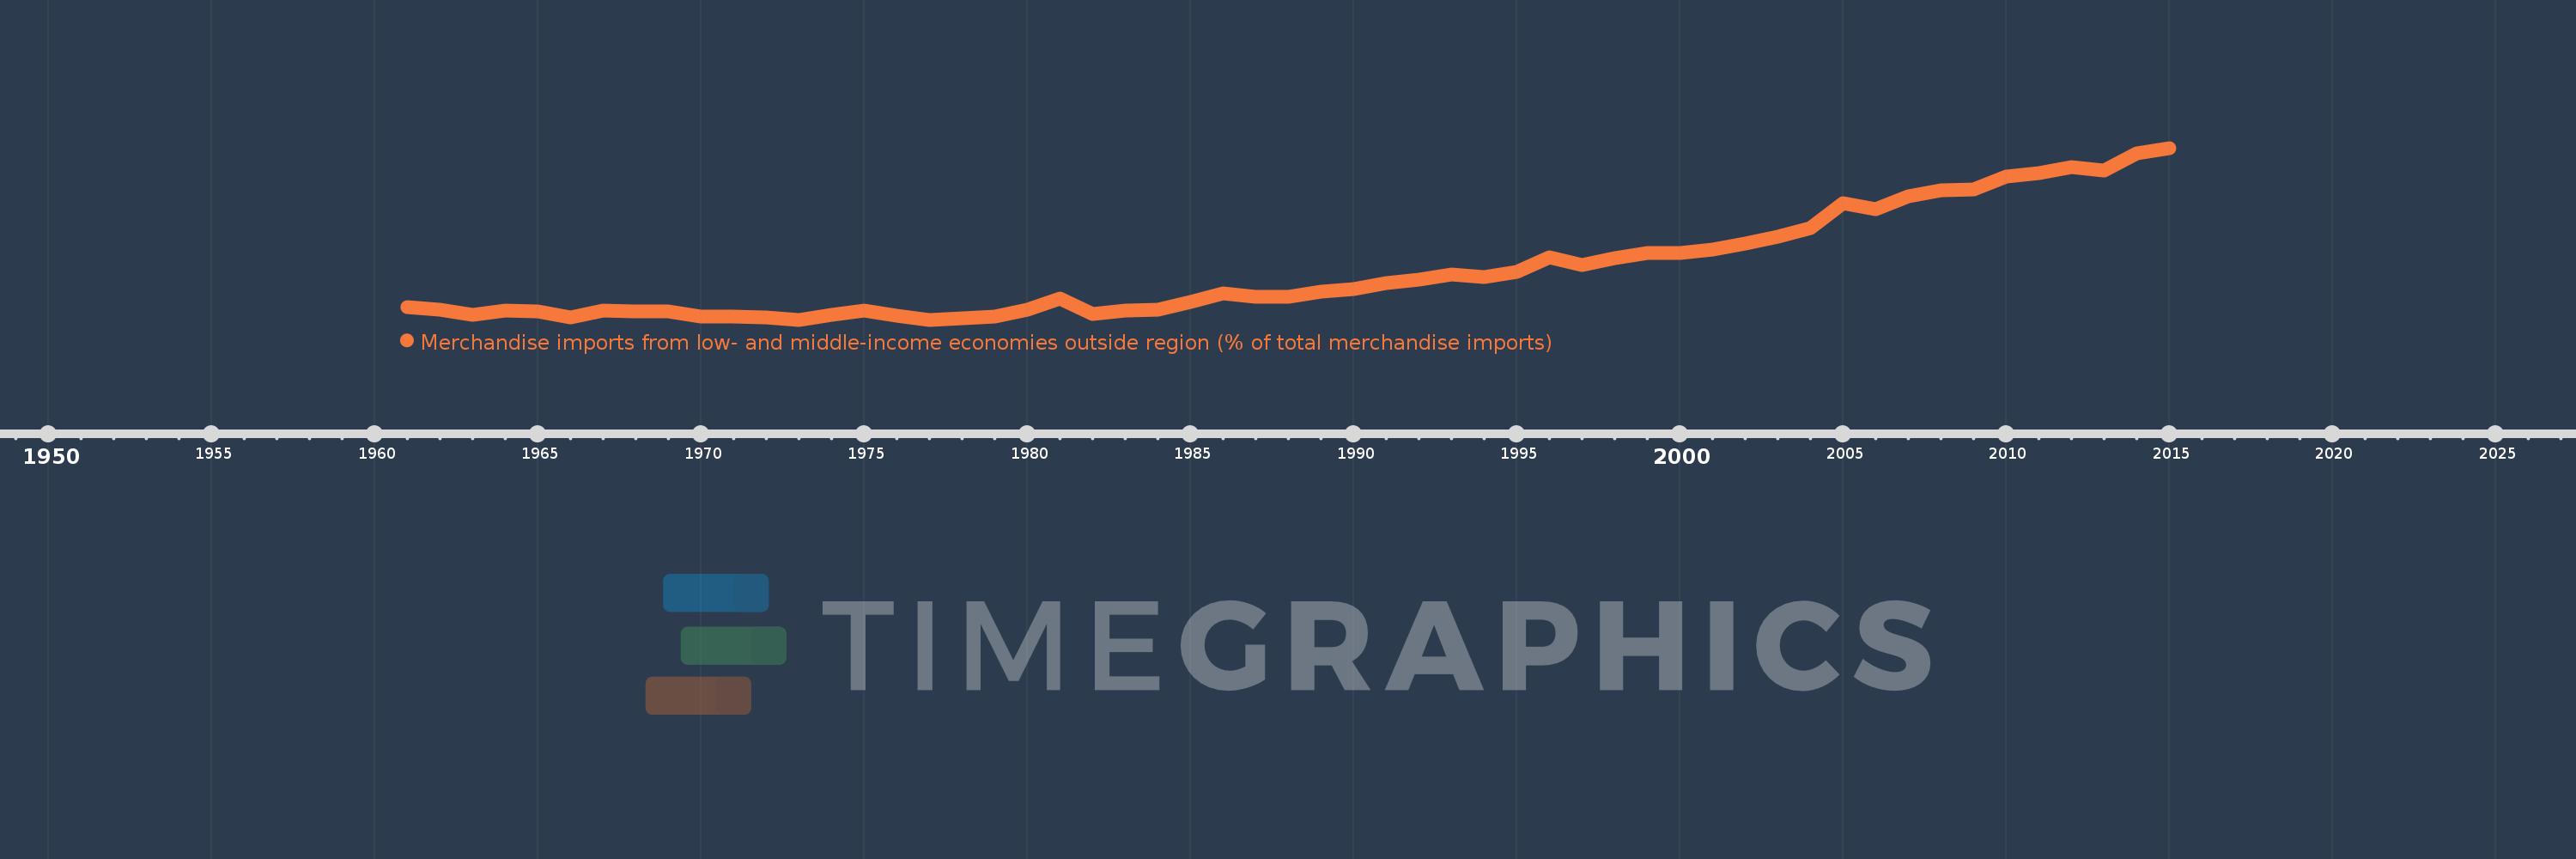
Merchandise imports from low- and middle-income economies outside region (% of total merchandise imports)
2015,2014,2013,2012,2011,2010,2009,2008,2007,2006,2005,2004,2003,2002,2001,2000,1999,1998,1997,1996,1995,1994,1993,1992,1991,1990,1989,1988,1987,1986,1985,1984,1983,1982,1981,1980,1979,1978,1977,1976,1975,1974,1973,1972,1971,1970,1969,1968,1967,1966,1965,1964,1963,1962,1961
This statistics in other country:
AfghanistanAlbaniaAlgeriaAngolaArab WorldArgentinaArmeniaArubaAustraliaAustriaAzerbaijanBahamas, TheBahrainBangladeshBarbadosBelarusBelgiumBelizeBeninBermudaBoliviaBrazilBrunei DarussalamBulgariaBurkina FasoBurundiCabo VerdeCambodiaCameroonCanadaCaribbean small statesCentral African RepublicCentral Europe and the BalticsChileChinaColombiaCongo, Dem. Rep.Congo, Rep.Costa RicaCote d'IvoireCroatiaCubaCyprusCzech RepublicDenmarkDominicaDominican RepublicEarly-demographic dividendEast Asia & PacificEast Asia & Pacific (excluding high income)East Asia & Pacific (IDA & IBRD countries)EcuadorEgypt, Arab Rep.El SalvadorEstoniaEthiopiaEuro areaEurope & Central AsiaEurope & Central Asia (excluding high income)Europe & Central Asia (IDA & IBRD countries)European UnionFijiFinlandFragile and conflict affected situationsFranceGabonGambia, TheGeorgiaGermanyGhanaGreeceGreenlandGrenadaGuatemalaGuineaGuyanaHaitiHeavily indebted poor countries (HIPC)High incomeHondurasHong Kong SAR, ChinaHungaryIBRD onlyIcelandIDA & IBRD totalIDA blendIDA onlyIDA totalIndiaIndonesiaIran, Islamic Rep.IraqIrelandIsraelItalyJamaicaJapanJordanKazakhstanKenyaKorea, Dem. People’s Rep.Korea, Rep.KuwaitKyrgyz RepublicLao PDRLate-demographic dividendLatin America & Caribbean Latin America & Caribbean (excluding high income)Latin America & the Caribbean (IDA & IBRD countries)LatviaLeast developed countries: UN classificationLebanonLiberiaLibyaLithuaniaLow & middle incomeLow incomeLower middle incomeLuxembourgMacao SAR, ChinaMacedonia, FYRMadagascarMalawiMalaysiaMaliMaltaMauritaniaMauritiusMexicoMiddle East & North AfricaMiddle East & North Africa (excluding high income)Middle East & North Africa (IDA & IBRD countries)Middle incomeMoldovaMongoliaMontenegroMoroccoMozambiqueMyanmarNetherlandsNew CaledoniaNew ZealandNicaraguaNigerNigeriaNorth AmericaNorwayOECD membersOmanOther small statesPacific island small statesPakistanPanamaPapua New GuineaParaguayPeruPhilippinesPolandPortugalPost-demographic dividendPre-demographic dividendQatarRomaniaRussian FederationRwandaSaudi ArabiaSenegalSerbiaSeychellesSierra LeoneSingaporeSlovak RepublicSloveniaSmall statesSomaliaSouth AfricaSouth AsiaSouth Asia (IDA & IBRD)SpainSri LankaSt. Kitts and NevisSt. LuciaSt. Vincent and the GrenadinesSub-Saharan Africa Sub-Saharan Africa (excluding high income)Sub-Saharan Africa (IDA & IBRD countries)SudanSurinameSwedenSwitzerlandSyrian Arab RepublicTanzaniaThailandTogoTrinidad and TobagoTunisiaTurkeyUgandaUkraineUnited Arab EmiratesUnited KingdomUnited StatesUpper middle incomeUruguayVenezuela, RBVietnamWorldYemen, Rep.ZambiaZimbabwe Timeline:
This timeline shows a graph from 1961 to 2015 of IDA total. No data until 1960. Number of actual observations by date: 55.
Source name:
World Development Indicators
Source organization:
World Bank staff estimates based data from International Monetary Fund's Direction of Trade database.
Categories, topics:
Private Sector, Trade
Last updated:
apr 23, 2017
Indicators value changes by year
Maximum:
25.478
jan 1, 2015
At the date of observation
Value
Absolute change
Change from previous value
jan 1, 1961
3.591
+3.591
0.0%
jan 1, 1962
3.273
-0.318
-8.85%
jan 1, 1963
2.591
-0.682
-20.83%
jan 1, 1964
3.132
+0.541
20.89%
jan 1, 1965
3.017
-0.115
-3.67%
jan 1, 1966
2.153
-0.864
-28.63%
jan 1, 1967
3.118
+0.965
44.8%
jan 1, 1968
2.98
-0.138
-4.42%
jan 1, 1969
2.982
+0.002
0.08%
jan 1, 1970
2.274
-0.708
-23.75%
jan 1, 1971
2.243
-0.031
-1.37%
jan 1, 1972
2.122
-0.121
-5.41%
jan 1, 1973
1.865
-0.257
-12.12%
jan 1, 1974
2.509
+0.645
34.59%
jan 1, 1975
3.141
+0.632
25.17%
jan 1, 1976
2.42
-0.721
-22.97%
jan 1, 1977
1.859
-0.561
-23.18%
jan 1, 1978
2.077
+0.219
11.76%
jan 1, 1979
2.285
+0.208
10.0%
jan 1, 1980
3.19
+0.905
39.6%
jan 1, 1981
4.727
+1.537
48.19%
jan 1, 1982
2.633
-2.094
-44.3%
jan 1, 1983
3.064
+0.431
16.36%
jan 1, 1984
3.287
+0.224
7.3%
jan 1, 1985
4.27
+0.983
29.89%
jan 1, 1986
5.479
+1.209
28.32%
jan 1, 1987
5.029
-0.451
-8.22%
jan 1, 1988
5.0
-0.029
-0.58%
jan 1, 1989
5.668
+0.669
13.38%
jan 1, 1990
6.124
+0.455
8.03%
jan 1, 1991
6.923
+0.799
13.05%
jan 1, 1992
7.325
+0.402
5.8%
jan 1, 1993
8.033
+0.708
9.67%
jan 1, 1994
7.733
-0.3
-3.73%
jan 1, 1995
8.436
+0.703
9.09%
jan 1, 1996
10.453
+2.017
23.91%
jan 1, 1997
9.367
-1.086
-10.39%
jan 1, 1998
10.371
+1.004
10.72%
jan 1, 1999
11.033
+0.663
6.39%
jan 1, 2000
10.987
-0.047
-0.42%
jan 1, 2001
11.454
+0.467
4.25%
jan 1, 2002
12.275
+0.82
7.16%
jan 1, 2003
13.234
+0.96
7.82%
jan 1, 2004
14.472
+1.238
9.36%
jan 1, 2005
17.905
+3.432
23.72%
jan 1, 2006
17.055
-0.849
-4.74%
jan 1, 2007
18.789
+1.734
10.17%
jan 1, 2008
19.624
+0.835
4.44%
jan 1, 2009
19.741
+0.118
0.6%
jan 1, 2010
21.531
+1.79
9.07%
jan 1, 2011
21.99
+0.459
2.13%
jan 1, 2012
22.889
+0.898
4.08%
jan 1, 2013
22.413
-0.476
-2.08%
jan 1, 2014
24.675
+2.262
10.09%
jan 1, 2015
25.478
+0.804
3.26%
Ranking of countries by current statistics by years


Comments: