29
/
en
AIzaSyAYiBZKx7MnpbEhh9jyipgxe19OcubqV5w
April 1, 2024
286181
Zambia
ZMB
true
2
1
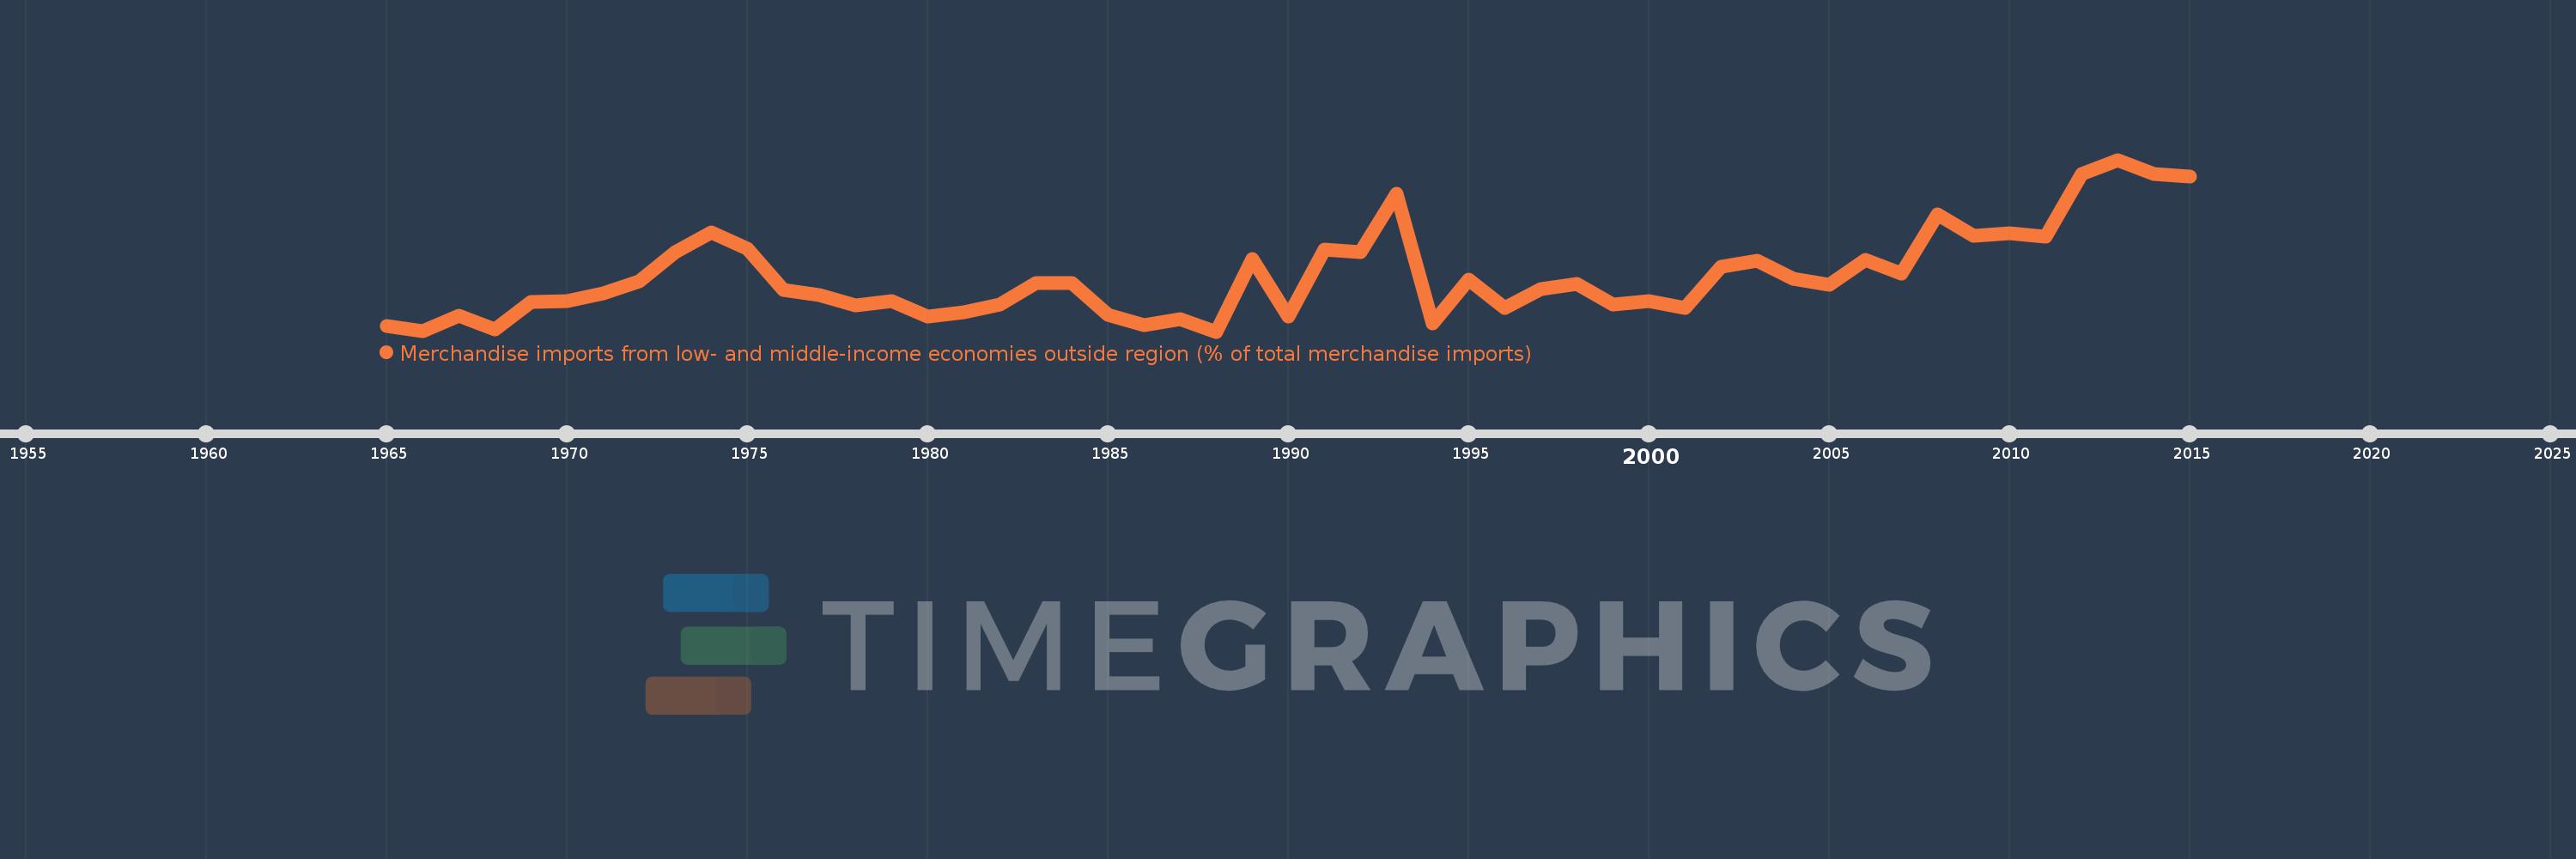
Merchandise imports from low- and middle-income economies outside region (% of total merchandise imports)
2015,2014,2013,2012,2011,2010,2009,2008,2007,2006,2005,2004,2003,2002,2001,2000,1999,1998,1997,1996,1995,1994,1993,1992,1991,1990,1989,1988,1987,1986,1985,1984,1983,1982,1981,1980,1979,1978,1977,1976,1975,1974,1973,1972,1971,1970,1969,1968,1967,1966,1965
This statistics in other country:
AfghanistanAlbaniaAlgeriaAngolaArab WorldArgentinaArmeniaArubaAustraliaAustriaAzerbaijanBahamas, TheBahrainBangladeshBarbadosBelarusBelgiumBelizeBeninBermudaBoliviaBrazilBrunei DarussalamBulgariaBurkina FasoBurundiCabo VerdeCambodiaCameroonCanadaCaribbean small statesCentral African RepublicCentral Europe and the BalticsChileChinaColombiaCongo, Dem. Rep.Congo, Rep.Costa RicaCote d'IvoireCroatiaCubaCyprusCzech RepublicDenmarkDominicaDominican RepublicEarly-demographic dividendEast Asia & PacificEast Asia & Pacific (excluding high income)East Asia & Pacific (IDA & IBRD countries)EcuadorEgypt, Arab Rep.El SalvadorEstoniaEthiopiaEuro areaEurope & Central AsiaEurope & Central Asia (excluding high income)Europe & Central Asia (IDA & IBRD countries)European UnionFijiFinlandFragile and conflict affected situationsFranceGabonGambia, TheGeorgiaGermanyGhanaGreeceGreenlandGrenadaGuatemalaGuineaGuyanaHaitiHeavily indebted poor countries (HIPC)High incomeHondurasHong Kong SAR, ChinaHungaryIBRD onlyIcelandIDA & IBRD totalIDA blendIDA onlyIDA totalIndiaIndonesiaIran, Islamic Rep.IraqIrelandIsraelItalyJamaicaJapanJordanKazakhstanKenyaKorea, Dem. People’s Rep.Korea, Rep.KuwaitKyrgyz RepublicLao PDRLate-demographic dividendLatin America & Caribbean Latin America & Caribbean (excluding high income)Latin America & the Caribbean (IDA & IBRD countries)LatviaLeast developed countries: UN classificationLebanonLiberiaLibyaLithuaniaLow & middle incomeLow incomeLower middle incomeLuxembourgMacao SAR, ChinaMacedonia, FYRMadagascarMalawiMalaysiaMaliMaltaMauritaniaMauritiusMexicoMiddle East & North AfricaMiddle East & North Africa (excluding high income)Middle East & North Africa (IDA & IBRD countries)Middle incomeMoldovaMongoliaMontenegroMoroccoMozambiqueMyanmarNetherlandsNew CaledoniaNew ZealandNicaraguaNigerNigeriaNorth AmericaNorwayOECD membersOmanOther small statesPacific island small statesPakistanPanamaPapua New GuineaParaguayPeruPhilippinesPolandPortugalPost-demographic dividendPre-demographic dividendQatarRomaniaRussian FederationRwandaSaudi ArabiaSenegalSerbiaSeychellesSierra LeoneSingaporeSlovak RepublicSloveniaSmall statesSomaliaSouth AfricaSouth AsiaSouth Asia (IDA & IBRD)SpainSri LankaSt. Kitts and NevisSt. LuciaSt. Vincent and the GrenadinesSub-Saharan Africa Sub-Saharan Africa (excluding high income)Sub-Saharan Africa (IDA & IBRD countries)SudanSurinameSwedenSwitzerlandSyrian Arab RepublicTanzaniaThailandTogoTrinidad and TobagoTunisiaTurkeyUgandaUkraineUnited Arab EmiratesUnited KingdomUnited StatesUpper middle incomeUruguayVenezuela, RBVietnamWorldYemen, Rep.ZambiaZimbabwe Timeline:
This timeline shows a graph from 1965 to 2015 of Zambia. No data until 1964. Number of actual observations by date: 51.
Source name:
World Development Indicators
Source organization:
World Bank staff estimates based data from International Monetary Fund's Direction of Trade database.
Categories, topics:
Private Sector, Trade
Last updated:
apr 23, 2017
Indicators value changes by year
Maximum:
15.999
jan 1, 2013
At the date of observation
Value
Absolute change
Change from previous value
jan 1, 1965
2.096
+2.096
0.0%
jan 1, 1966
1.635
-0.461
-21.99%
jan 1, 1967
2.976
+1.341
82.05%
jan 1, 1968
1.826
-1.151
-38.66%
jan 1, 1969
4.103
+2.278
124.75%
jan 1, 1970
4.143
+0.039
0.96%
jan 1, 1971
4.802
+0.659
15.92%
jan 1, 1972
5.796
+0.994
20.7%
jan 1, 1973
8.307
+2.511
43.32%
jan 1, 1974
9.93
+1.624
19.54%
jan 1, 1975
8.592
-1.339
-13.48%
jan 1, 1976
5.092
-3.5
-40.73%
jan 1, 1977
4.67
-0.422
-8.3%
jan 1, 1978
3.835
-0.834
-17.86%
jan 1, 1979
4.197
+0.361
9.42%
jan 1, 1980
2.875
-1.322
-31.5%
jan 1, 1981
3.261
+0.386
13.43%
jan 1, 1982
3.888
+0.627
19.22%
jan 1, 1983
5.689
+1.8
46.31%
jan 1, 1984
5.689
0.0
0.0%
jan 1, 1985
3.061
-2.628
-46.19%
jan 1, 1986
2.171
-0.89
-29.06%
jan 1, 1987
2.643
+0.471
21.71%
jan 1, 1988
1.624
-1.019
-38.56%
jan 1, 1989
7.732
+6.108
376.23%
jan 1, 1990
2.866
-4.865
-62.93%
jan 1, 1991
8.495
+5.628
196.34%
jan 1, 1992
8.302
-0.192
-2.26%
jan 1, 1993
13.154
+4.851
58.43%
jan 1, 1994
2.275
-10.879
-82.71%
jan 1, 1995
5.979
+3.704
162.84%
jan 1, 1996
3.625
-2.354
-39.36%
jan 1, 1997
5.213
+1.588
43.79%
jan 1, 1998
5.643
+0.43
8.26%
jan 1, 1999
3.882
-1.761
-31.21%
jan 1, 2000
4.172
+0.29
7.48%
jan 1, 2001
3.617
-0.556
-13.32%
jan 1, 2002
7.069
+3.452
95.45%
jan 1, 2003
7.522
+0.453
6.41%
jan 1, 2004
6.059
-1.463
-19.45%
jan 1, 2005
5.54
-0.519
-8.56%
jan 1, 2006
7.609
+2.069
37.35%
jan 1, 2007
6.509
-1.1
-14.45%
jan 1, 2008
11.449
+4.94
75.89%
jan 1, 2009
9.611
-1.838
-16.05%
jan 1, 2010
9.885
+0.274
2.85%
jan 1, 2011
9.555
-0.33
-3.34%
jan 1, 2012
14.847
+5.292
55.39%
jan 1, 2013
15.999
+1.152
7.76%
jan 1, 2014
14.846
-1.154
-7.21%
jan 1, 2015
14.627
-0.219
-1.47%
Ranking of countries by current statistics by years


Comments: