29
/
en
AIzaSyAYiBZKx7MnpbEhh9jyipgxe19OcubqV5w
April 1, 2024
157580
Iran, Islamic Rep.
IRN
true
2
1
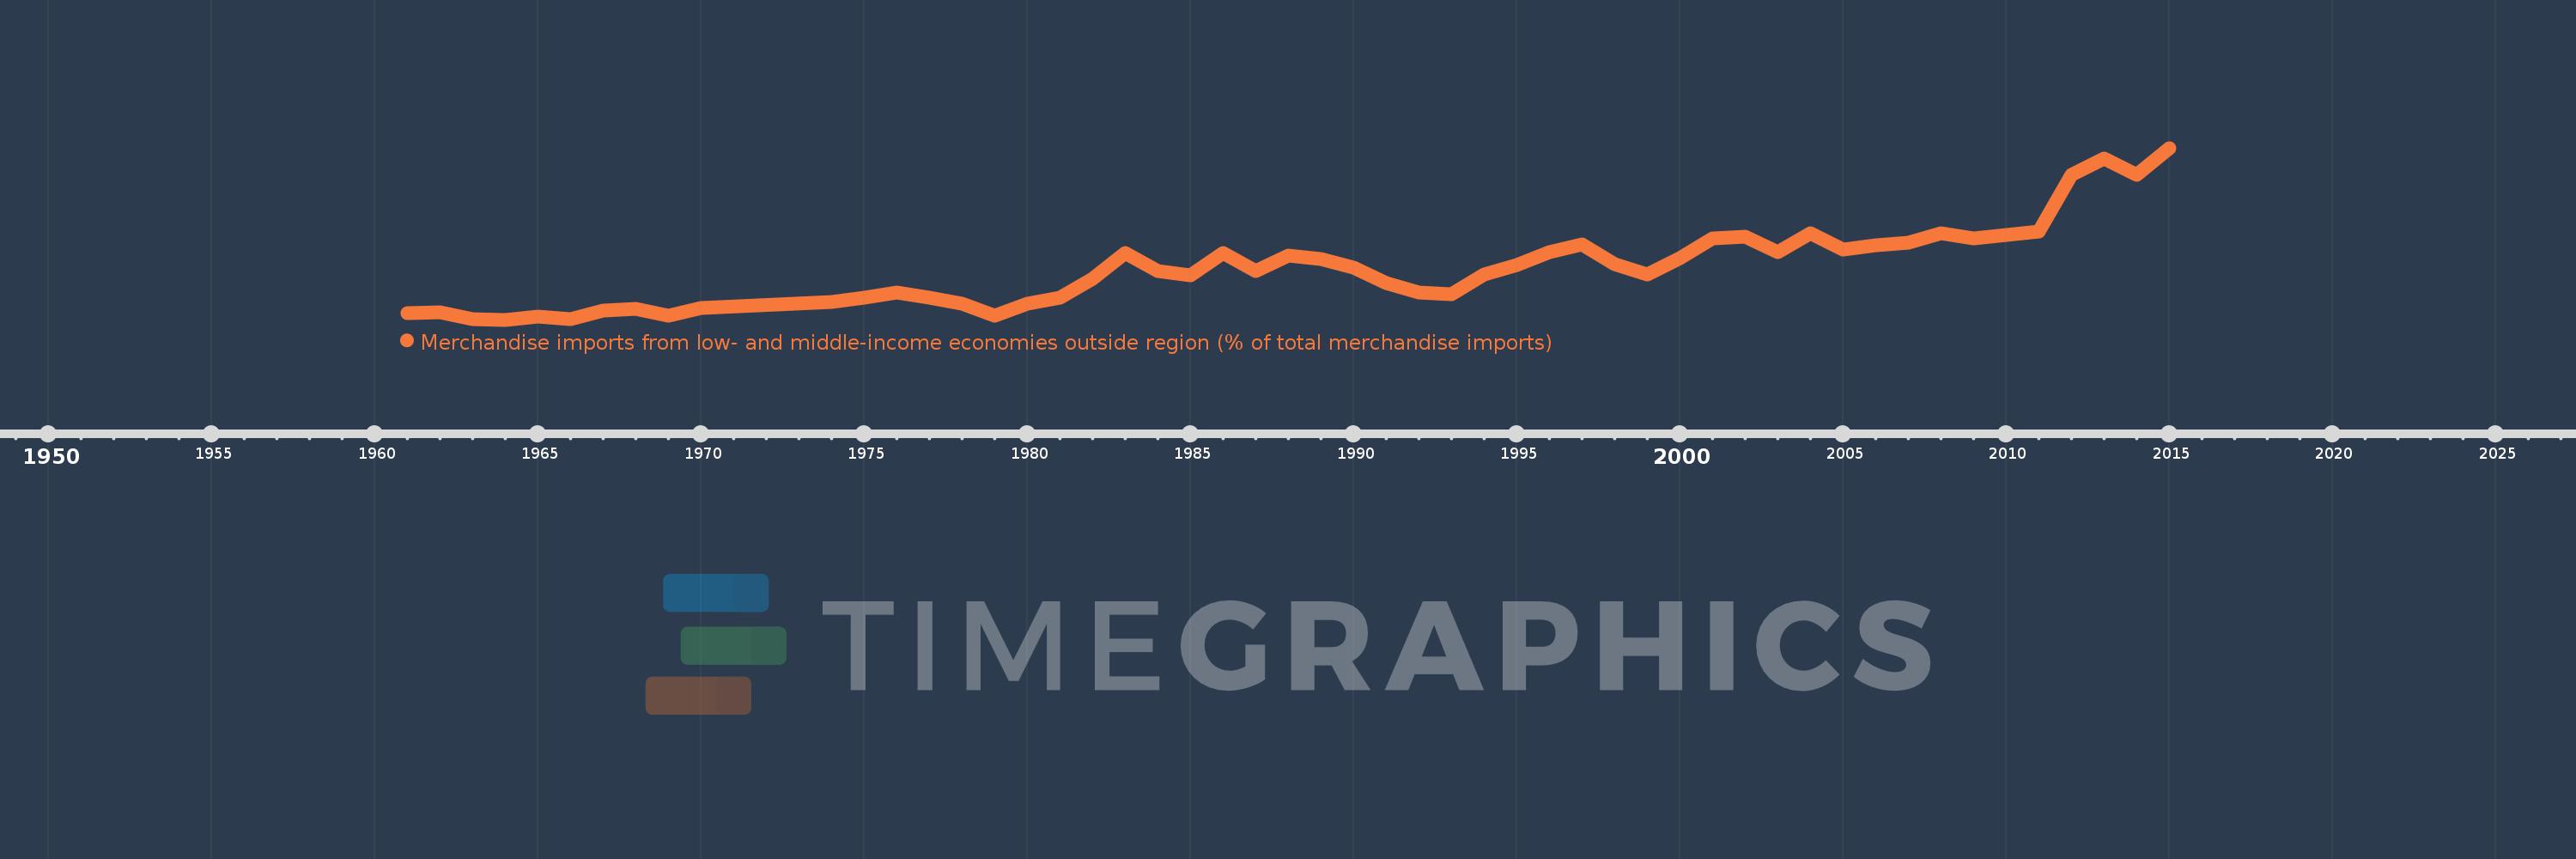
Merchandise imports from low- and middle-income economies outside region (% of total merchandise imports)
2015,2014,2013,2012,2011,2010,2009,2008,2007,2006,2005,2004,2003,2002,2001,2000,1999,1998,1997,1996,1995,1994,1993,1992,1991,1990,1989,1988,1987,1986,1985,1984,1983,1982,1981,1980,1979,1978,1977,1976,1975,1974,1970,1969,1968,1967,1966,1965,1964,1963,1962,1961
This statistics in other country:
AfghanistanAlbaniaAlgeriaAngolaArab WorldArgentinaArmeniaArubaAustraliaAustriaAzerbaijanBahamas, TheBahrainBangladeshBarbadosBelarusBelgiumBelizeBeninBermudaBoliviaBrazilBrunei DarussalamBulgariaBurkina FasoBurundiCabo VerdeCambodiaCameroonCanadaCaribbean small statesCentral African RepublicCentral Europe and the BalticsChileChinaColombiaCongo, Dem. Rep.Congo, Rep.Costa RicaCote d'IvoireCroatiaCubaCyprusCzech RepublicDenmarkDominicaDominican RepublicEarly-demographic dividendEast Asia & PacificEast Asia & Pacific (excluding high income)East Asia & Pacific (IDA & IBRD countries)EcuadorEgypt, Arab Rep.El SalvadorEstoniaEthiopiaEuro areaEurope & Central AsiaEurope & Central Asia (excluding high income)Europe & Central Asia (IDA & IBRD countries)European UnionFijiFinlandFragile and conflict affected situationsFranceGabonGambia, TheGeorgiaGermanyGhanaGreeceGreenlandGrenadaGuatemalaGuineaGuyanaHaitiHeavily indebted poor countries (HIPC)High incomeHondurasHong Kong SAR, ChinaHungaryIBRD onlyIcelandIDA & IBRD totalIDA blendIDA onlyIDA totalIndiaIndonesiaIran, Islamic Rep.IraqIrelandIsraelItalyJamaicaJapanJordanKazakhstanKenyaKorea, Dem. People’s Rep.Korea, Rep.KuwaitKyrgyz RepublicLao PDRLate-demographic dividendLatin America & Caribbean Latin America & Caribbean (excluding high income)Latin America & the Caribbean (IDA & IBRD countries)LatviaLeast developed countries: UN classificationLebanonLiberiaLibyaLithuaniaLow & middle incomeLow incomeLower middle incomeLuxembourgMacao SAR, ChinaMacedonia, FYRMadagascarMalawiMalaysiaMaliMaltaMauritaniaMauritiusMexicoMiddle East & North AfricaMiddle East & North Africa (excluding high income)Middle East & North Africa (IDA & IBRD countries)Middle incomeMoldovaMongoliaMontenegroMoroccoMozambiqueMyanmarNetherlandsNew CaledoniaNew ZealandNicaraguaNigerNigeriaNorth AmericaNorwayOECD membersOmanOther small statesPacific island small statesPakistanPanamaPapua New GuineaParaguayPeruPhilippinesPolandPortugalPost-demographic dividendPre-demographic dividendQatarRomaniaRussian FederationRwandaSaudi ArabiaSenegalSerbiaSeychellesSierra LeoneSingaporeSlovak RepublicSloveniaSmall statesSomaliaSouth AfricaSouth AsiaSouth Asia (IDA & IBRD)SpainSri LankaSt. Kitts and NevisSt. LuciaSt. Vincent and the GrenadinesSub-Saharan Africa Sub-Saharan Africa (excluding high income)Sub-Saharan Africa (IDA & IBRD countries)SudanSurinameSwedenSwitzerlandSyrian Arab RepublicTanzaniaThailandTogoTrinidad and TobagoTunisiaTurkeyUgandaUkraineUnited Arab EmiratesUnited KingdomUnited StatesUpper middle incomeUruguayVenezuela, RBVietnamWorldYemen, Rep.ZambiaZimbabwe Timeline:
This timeline shows a graph from 1961 to 2015 of Iran, Islamic Rep.. No data until 1960. Number of actual observations by date: 52.
Source name:
World Development Indicators
Source organization:
World Bank staff estimates based data from International Monetary Fund's Direction of Trade database.
Categories, topics:
Private Sector, Trade
Last updated:
apr 23, 2017
Indicators value changes by year
Maximum:
40.676
jan 1, 2015
At the date of observation
Value
Absolute change
Change from previous value
jan 1, 1961
5.261
+5.261
0.0%
jan 1, 1962
5.403
+0.142
2.7%
jan 1, 1963
4.053
-1.35
-24.99%
jan 1, 1964
3.865
-0.188
-4.63%
jan 1, 1965
4.485
+0.62
16.03%
jan 1, 1966
4.034
-0.451
-10.06%
jan 1, 1967
5.902
+1.868
46.32%
jan 1, 1968
6.166
+0.264
4.48%
jan 1, 1969
4.688
-1.478
-23.97%
jan 1, 1970
6.465
+1.777
37.91%
jan 1, 1974
7.757
+1.292
19.98%
jan 1, 1975
8.609
+0.852
10.99%
jan 1, 1976
9.654
+1.045
12.14%
jan 1, 1977
8.509
-1.145
-11.86%
jan 1, 1978
7.299
-1.21
-14.22%
jan 1, 1979
4.782
-2.517
-34.48%
jan 1, 1980
7.396
+2.613
54.65%
jan 1, 1981
8.581
+1.186
16.03%
jan 1, 1982
12.564
+3.982
46.41%
jan 1, 1983
18.1
+5.537
44.07%
jan 1, 1984
14.357
-3.744
-20.68%
jan 1, 1985
13.378
-0.979
-6.82%
jan 1, 1986
18.154
+4.776
35.7%
jan 1, 1987
14.292
-3.862
-21.27%
jan 1, 1988
17.569
+3.277
22.93%
jan 1, 1989
16.84
-0.729
-4.15%
jan 1, 1990
14.992
-1.848
-10.98%
jan 1, 1991
11.661
-3.33
-22.21%
jan 1, 1992
9.643
-2.019
-17.31%
jan 1, 1993
9.291
-0.351
-3.64%
jan 1, 1994
13.483
+4.191
45.11%
jan 1, 1995
15.559
+2.077
15.4%
jan 1, 1996
18.418
+2.859
18.37%
jan 1, 1997
20.04
+1.622
8.81%
jan 1, 1998
15.711
-4.329
-21.6%
jan 1, 1999
13.601
-2.111
-13.43%
jan 1, 2000
17.086
+3.485
25.63%
jan 1, 2001
21.294
+4.208
24.63%
jan 1, 2002
21.606
+0.312
1.46%
jan 1, 2003
18.357
-3.249
-15.04%
jan 1, 2004
22.441
+4.084
22.25%
jan 1, 2005
18.838
-3.603
-16.05%
jan 1, 2006
19.8
+0.962
5.11%
jan 1, 2007
20.333
+0.533
2.69%
jan 1, 2008
22.328
+1.994
9.81%
jan 1, 2009
21.31
-1.018
-4.56%
jan 1, 2010
22.032
+0.722
3.39%
jan 1, 2011
22.817
+0.785
3.56%
jan 1, 2012
34.959
+12.142
53.21%
jan 1, 2013
38.46
+3.501
10.02%
jan 1, 2014
34.984
-3.476
-9.04%
jan 1, 2015
40.676
+5.692
16.27%
Ranking of countries by current statistics by years


Comments: