29
/
en
AIzaSyAYiBZKx7MnpbEhh9jyipgxe19OcubqV5w
April 1, 2024
134375
France
FRA
true
2
1
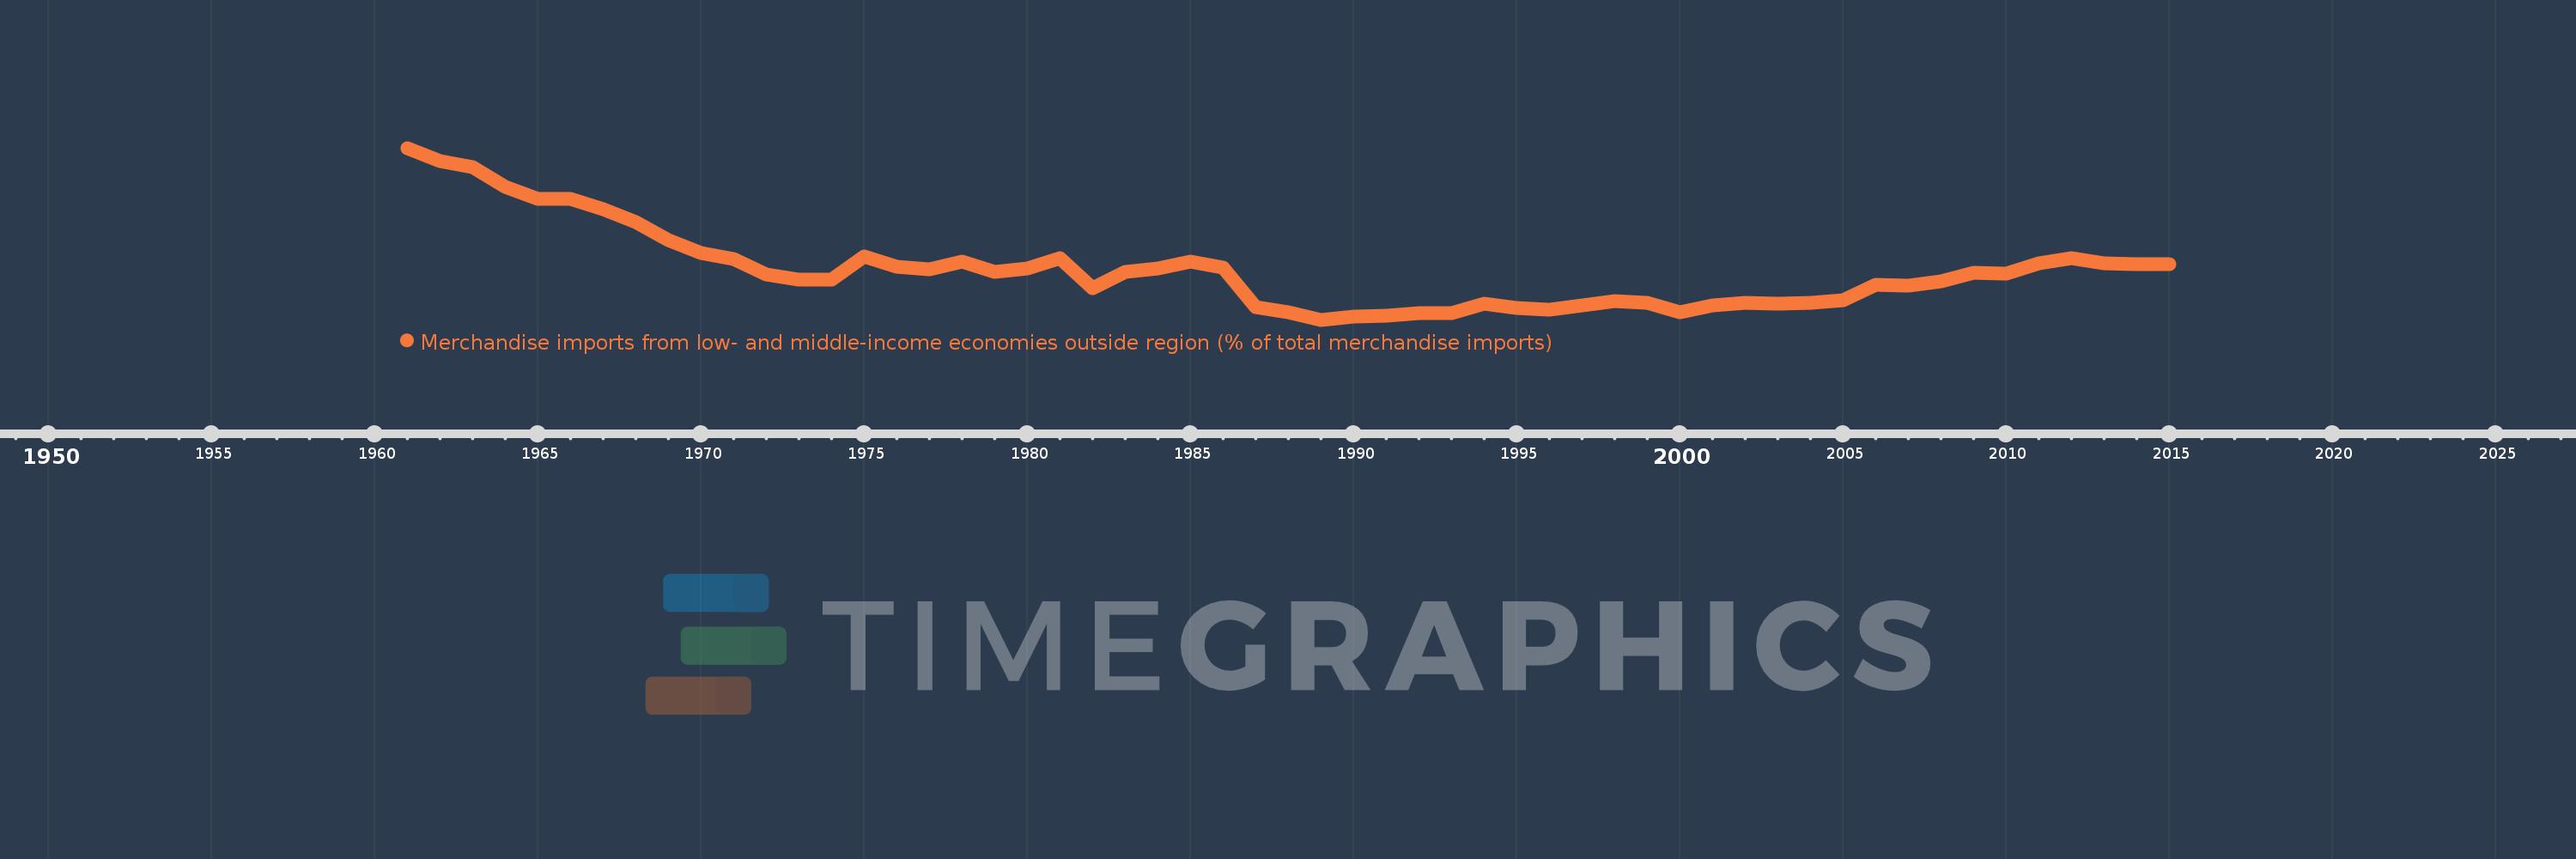
Merchandise imports from low- and middle-income economies outside region (% of total merchandise imports)
2015,2014,2013,2012,2011,2010,2009,2008,2007,2006,2005,2004,2003,2002,2001,2000,1999,1998,1997,1996,1995,1994,1993,1992,1991,1990,1989,1988,1987,1986,1985,1984,1983,1982,1981,1980,1979,1978,1977,1976,1975,1974,1973,1972,1971,1970,1969,1968,1967,1966,1965,1964,1963,1962,1961
This statistics in other country:
AfghanistanAlbaniaAlgeriaAngolaArab WorldArgentinaArmeniaArubaAustraliaAustriaAzerbaijanBahamas, TheBahrainBangladeshBarbadosBelarusBelgiumBelizeBeninBermudaBoliviaBrazilBrunei DarussalamBulgariaBurkina FasoBurundiCabo VerdeCambodiaCameroonCanadaCaribbean small statesCentral African RepublicCentral Europe and the BalticsChileChinaColombiaCongo, Dem. Rep.Congo, Rep.Costa RicaCote d'IvoireCroatiaCubaCyprusCzech RepublicDenmarkDominicaDominican RepublicEarly-demographic dividendEast Asia & PacificEast Asia & Pacific (excluding high income)East Asia & Pacific (IDA & IBRD countries)EcuadorEgypt, Arab Rep.El SalvadorEstoniaEthiopiaEuro areaEurope & Central AsiaEurope & Central Asia (excluding high income)Europe & Central Asia (IDA & IBRD countries)European UnionFijiFinlandFragile and conflict affected situationsFranceGabonGambia, TheGeorgiaGermanyGhanaGreeceGreenlandGrenadaGuatemalaGuineaGuyanaHaitiHeavily indebted poor countries (HIPC)High incomeHondurasHong Kong SAR, ChinaHungaryIBRD onlyIcelandIDA & IBRD totalIDA blendIDA onlyIDA totalIndiaIndonesiaIran, Islamic Rep.IraqIrelandIsraelItalyJamaicaJapanJordanKazakhstanKenyaKorea, Dem. People’s Rep.Korea, Rep.KuwaitKyrgyz RepublicLao PDRLate-demographic dividendLatin America & Caribbean Latin America & Caribbean (excluding high income)Latin America & the Caribbean (IDA & IBRD countries)LatviaLeast developed countries: UN classificationLebanonLiberiaLibyaLithuaniaLow & middle incomeLow incomeLower middle incomeLuxembourgMacao SAR, ChinaMacedonia, FYRMadagascarMalawiMalaysiaMaliMaltaMauritaniaMauritiusMexicoMiddle East & North AfricaMiddle East & North Africa (excluding high income)Middle East & North Africa (IDA & IBRD countries)Middle incomeMoldovaMongoliaMontenegroMoroccoMozambiqueMyanmarNetherlandsNew CaledoniaNew ZealandNicaraguaNigerNigeriaNorth AmericaNorwayOECD membersOmanOther small statesPacific island small statesPakistanPanamaPapua New GuineaParaguayPeruPhilippinesPolandPortugalPost-demographic dividendPre-demographic dividendQatarRomaniaRussian FederationRwandaSaudi ArabiaSenegalSerbiaSeychellesSierra LeoneSingaporeSlovak RepublicSloveniaSmall statesSomaliaSouth AfricaSouth AsiaSouth Asia (IDA & IBRD)SpainSri LankaSt. Kitts and NevisSt. LuciaSt. Vincent and the GrenadinesSub-Saharan Africa Sub-Saharan Africa (excluding high income)Sub-Saharan Africa (IDA & IBRD countries)SudanSurinameSwedenSwitzerlandSyrian Arab RepublicTanzaniaThailandTogoTrinidad and TobagoTunisiaTurkeyUgandaUkraineUnited Arab EmiratesUnited KingdomUnited StatesUpper middle incomeUruguayVenezuela, RBVietnamWorldYemen, Rep.ZambiaZimbabwe Timeline:
This timeline shows a graph from 1961 to 2015 of France. No data until 1960. Number of actual observations by date: 55.
Source name:
World Development Indicators
Source organization:
World Bank staff estimates based data from International Monetary Fund's Direction of Trade database.
Categories, topics:
Private Sector, Trade
Last updated:
apr 23, 2017
Indicators value changes by year
Maximum:
30.405
jan 1, 1961
At the date of observation
Value
Absolute change
Change from previous value
jan 1, 1961
30.405
+30.405
0.0%
jan 1, 1962
28.857
-1.548
-5.09%
jan 1, 1963
28.13
-0.727
-2.52%
jan 1, 1964
25.787
-2.343
-8.33%
jan 1, 1965
24.337
-1.45
-5.62%
jan 1, 1966
24.341
+0.004
0.02%
jan 1, 1967
23.084
-1.257
-5.17%
jan 1, 1968
21.531
-1.553
-6.73%
jan 1, 1969
19.327
-2.204
-10.23%
jan 1, 1970
17.872
-1.455
-7.53%
jan 1, 1971
17.115
-0.758
-4.24%
jan 1, 1972
15.296
-1.818
-10.62%
jan 1, 1973
14.627
-0.67
-4.38%
jan 1, 1974
14.656
+0.029
0.2%
jan 1, 1975
17.372
+2.716
18.53%
jan 1, 1976
16.233
-1.139
-6.56%
jan 1, 1977
15.905
-0.327
-2.02%
jan 1, 1978
16.828
+0.922
5.8%
jan 1, 1979
15.619
-1.209
-7.18%
jan 1, 1980
16.005
+0.386
2.47%
jan 1, 1981
17.224
+1.219
7.62%
jan 1, 1982
13.631
-3.593
-20.86%
jan 1, 1983
15.567
+1.936
14.2%
jan 1, 1984
16.01
+0.443
2.85%
jan 1, 1985
16.79
+0.779
4.87%
jan 1, 1986
16.052
-0.738
-4.39%
jan 1, 1987
11.341
-4.711
-29.35%
jan 1, 1988
10.771
-0.569
-5.02%
jan 1, 1989
9.845
-0.926
-8.6%
jan 1, 1990
10.271
+0.426
4.33%
jan 1, 1991
10.352
+0.081
0.79%
jan 1, 1992
10.622
+0.27
2.61%
jan 1, 1993
10.59
-0.032
-0.3%
jan 1, 1994
11.733
+1.143
10.79%
jan 1, 1995
11.224
-0.508
-4.33%
jan 1, 1996
11.015
-0.21
-1.87%
jan 1, 1997
11.581
+0.566
5.14%
jan 1, 1998
12.081
+0.5
4.32%
jan 1, 1999
11.893
-0.188
-1.55%
jan 1, 2000
10.764
-1.129
-9.49%
jan 1, 2001
11.587
+0.822
7.64%
jan 1, 2002
11.824
+0.238
2.05%
jan 1, 2003
11.787
-0.037
-0.31%
jan 1, 2004
11.844
+0.057
0.48%
jan 1, 2005
12.217
+0.372
3.14%
jan 1, 2006
14.054
+1.837
15.04%
jan 1, 2007
13.941
-0.113
-0.81%
jan 1, 2008
14.434
+0.493
3.54%
jan 1, 2009
15.486
+1.052
7.29%
jan 1, 2010
15.336
-0.15
-0.97%
jan 1, 2011
16.562
+1.225
7.99%
jan 1, 2012
17.174
+0.612
3.7%
jan 1, 2013
16.57
-0.603
-3.51%
jan 1, 2014
16.508
-0.063
-0.38%
jan 1, 2015
16.47
-0.038
-0.23%
Ranking of countries by current statistics by years


Comments: