29
/
en
AIzaSyAYiBZKx7MnpbEhh9jyipgxe19OcubqV5w
April 1, 2024
37562
IDA & IBRD total
IBT
false
2
1
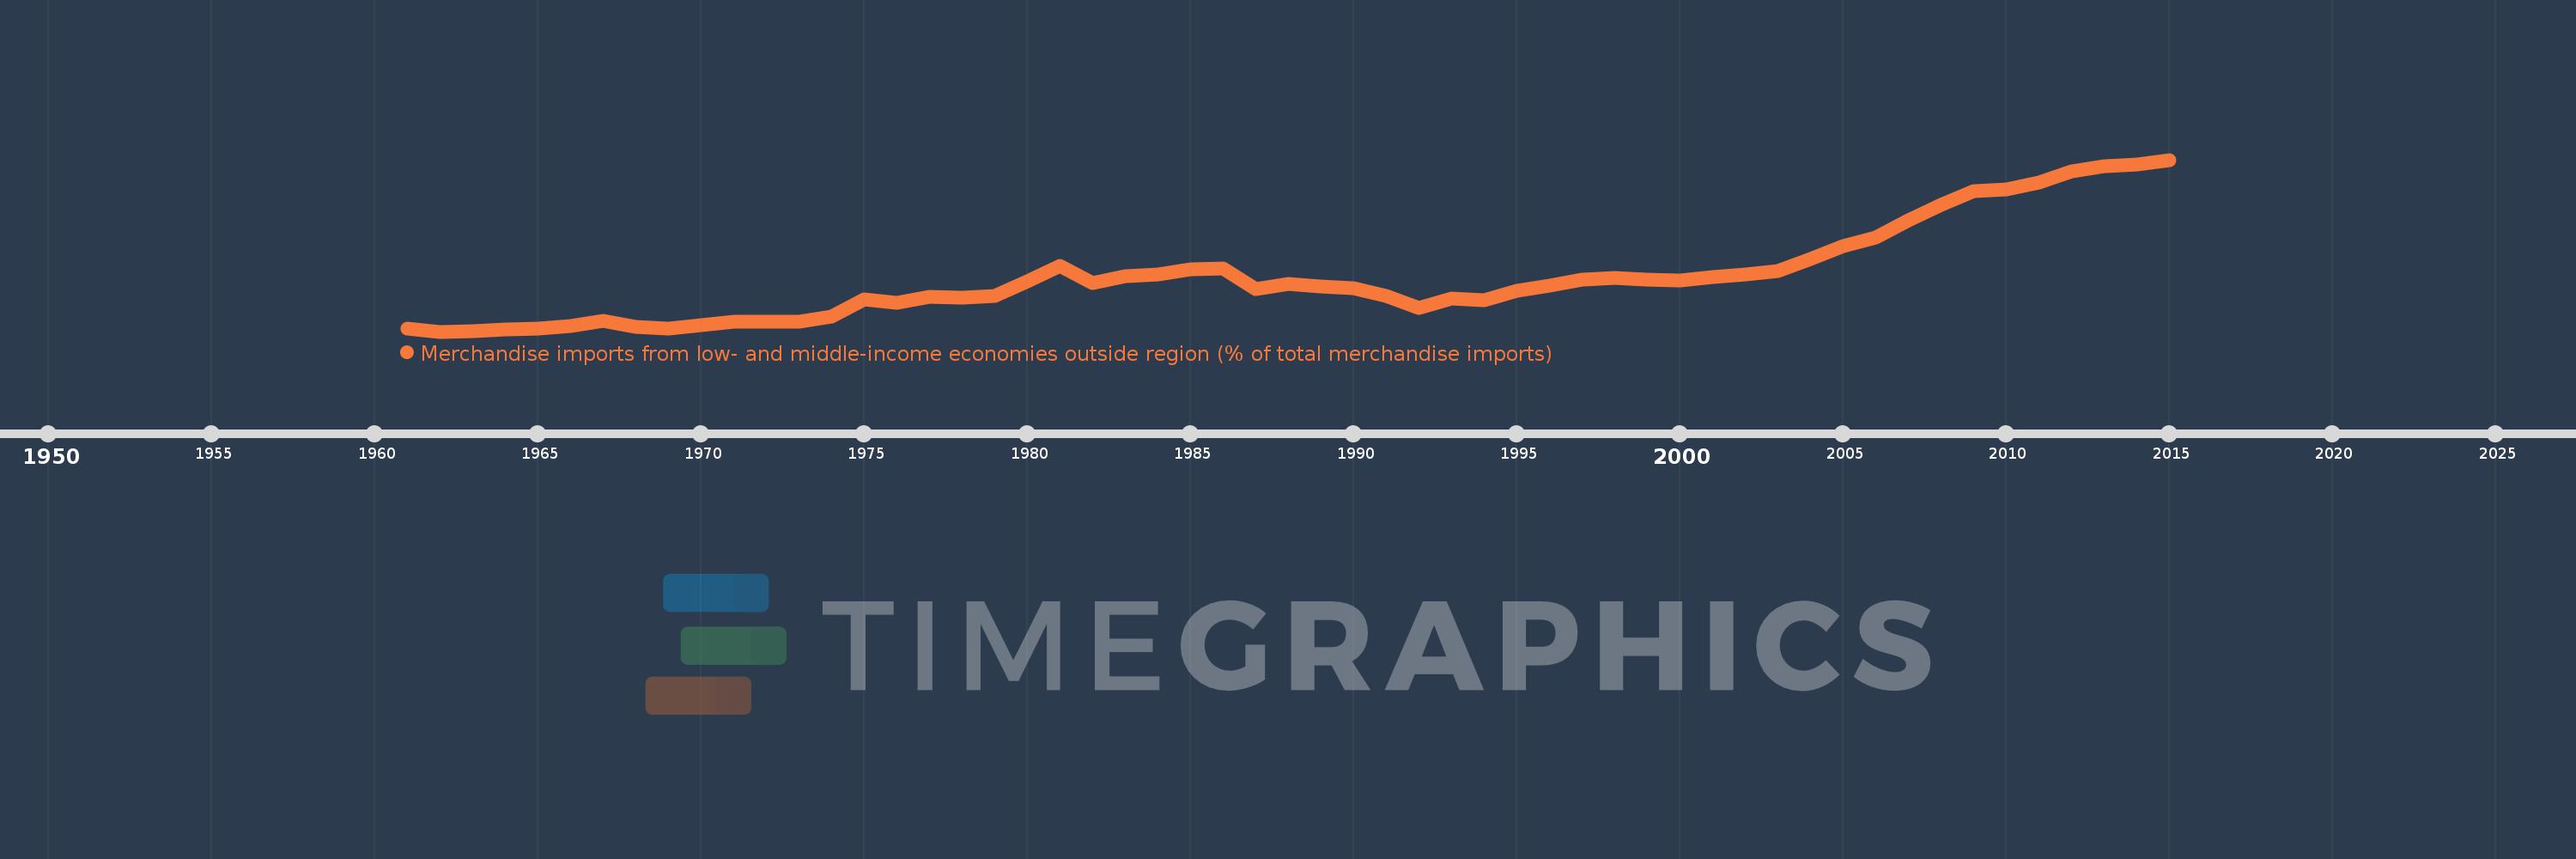
Merchandise imports from low- and middle-income economies outside region (% of total merchandise imports)
2015,2014,2013,2012,2011,2010,2009,2008,2007,2006,2005,2004,2003,2002,2001,2000,1999,1998,1997,1996,1995,1994,1993,1992,1991,1990,1989,1988,1987,1986,1985,1984,1983,1982,1981,1980,1979,1978,1977,1976,1975,1974,1973,1972,1971,1970,1969,1968,1967,1966,1965,1964,1963,1962,1961
This statistics in other country:
AfghanistanAlbaniaAlgeriaAngolaArab WorldArgentinaArmeniaArubaAustraliaAustriaAzerbaijanBahamas, TheBahrainBangladeshBarbadosBelarusBelgiumBelizeBeninBermudaBoliviaBrazilBrunei DarussalamBulgariaBurkina FasoBurundiCabo VerdeCambodiaCameroonCanadaCaribbean small statesCentral African RepublicCentral Europe and the BalticsChileChinaColombiaCongo, Dem. Rep.Congo, Rep.Costa RicaCote d'IvoireCroatiaCubaCyprusCzech RepublicDenmarkDominicaDominican RepublicEarly-demographic dividendEast Asia & PacificEast Asia & Pacific (excluding high income)East Asia & Pacific (IDA & IBRD countries)EcuadorEgypt, Arab Rep.El SalvadorEstoniaEthiopiaEuro areaEurope & Central AsiaEurope & Central Asia (excluding high income)Europe & Central Asia (IDA & IBRD countries)European UnionFijiFinlandFragile and conflict affected situationsFranceGabonGambia, TheGeorgiaGermanyGhanaGreeceGreenlandGrenadaGuatemalaGuineaGuyanaHaitiHeavily indebted poor countries (HIPC)High incomeHondurasHong Kong SAR, ChinaHungaryIBRD onlyIcelandIDA & IBRD totalIDA blendIDA onlyIDA totalIndiaIndonesiaIran, Islamic Rep.IraqIrelandIsraelItalyJamaicaJapanJordanKazakhstanKenyaKorea, Dem. People’s Rep.Korea, Rep.KuwaitKyrgyz RepublicLao PDRLate-demographic dividendLatin America & Caribbean Latin America & Caribbean (excluding high income)Latin America & the Caribbean (IDA & IBRD countries)LatviaLeast developed countries: UN classificationLebanonLiberiaLibyaLithuaniaLow & middle incomeLow incomeLower middle incomeLuxembourgMacao SAR, ChinaMacedonia, FYRMadagascarMalawiMalaysiaMaliMaltaMauritaniaMauritiusMexicoMiddle East & North AfricaMiddle East & North Africa (excluding high income)Middle East & North Africa (IDA & IBRD countries)Middle incomeMoldovaMongoliaMontenegroMoroccoMozambiqueMyanmarNetherlandsNew CaledoniaNew ZealandNicaraguaNigerNigeriaNorth AmericaNorwayOECD membersOmanOther small statesPacific island small statesPakistanPanamaPapua New GuineaParaguayPeruPhilippinesPolandPortugalPost-demographic dividendPre-demographic dividendQatarRomaniaRussian FederationRwandaSaudi ArabiaSenegalSerbiaSeychellesSierra LeoneSingaporeSlovak RepublicSloveniaSmall statesSomaliaSouth AfricaSouth AsiaSouth Asia (IDA & IBRD)SpainSri LankaSt. Kitts and NevisSt. LuciaSt. Vincent and the GrenadinesSub-Saharan Africa Sub-Saharan Africa (excluding high income)Sub-Saharan Africa (IDA & IBRD countries)SudanSurinameSwedenSwitzerlandSyrian Arab RepublicTanzaniaThailandTogoTrinidad and TobagoTunisiaTurkeyUgandaUkraineUnited Arab EmiratesUnited KingdomUnited StatesUpper middle incomeUruguayVenezuela, RBVietnamWorldYemen, Rep.ZambiaZimbabwe Timeline:
This timeline shows a graph from 1961 to 2015 of IDA & IBRD total. No data until 1960. Number of actual observations by date: 55.
Source name:
World Development Indicators
Source organization:
World Bank staff estimates based data from International Monetary Fund's Direction of Trade database.
Categories, topics:
Private Sector, Trade
Last updated:
apr 23, 2017
Indicators value changes by year
At the date of observation
Value
Absolute change
Change from previous value
jan 1, 1961
4.752
+4.752
0.0%
jan 1, 1962
4.432
-0.32
-6.74%
jan 1, 1963
4.491
+0.06
1.34%
jan 1, 1964
4.611
+0.119
2.66%
jan 1, 1965
4.774
+0.163
3.53%
jan 1, 1966
4.976
+0.202
4.23%
jan 1, 1967
5.523
+0.548
11.01%
jan 1, 1968
4.938
-0.585
-10.59%
jan 1, 1969
4.769
-0.169
-3.43%
jan 1, 1970
5.091
+0.322
6.76%
jan 1, 1971
5.424
+0.333
6.54%
jan 1, 1972
5.485
+0.061
1.13%
jan 1, 1973
5.491
+0.006
0.11%
jan 1, 1974
6.0
+0.509
9.27%
jan 1, 1975
7.765
+1.765
29.41%
jan 1, 1976
7.429
-0.336
-4.33%
jan 1, 1977
8.011
+0.583
7.84%
jan 1, 1978
7.902
-0.11
-1.37%
jan 1, 1979
8.108
+0.206
2.61%
jan 1, 1980
9.644
+1.536
18.94%
jan 1, 1981
11.201
+1.557
16.15%
jan 1, 1982
9.453
-1.748
-15.6%
jan 1, 1983
10.181
+0.728
7.7%
jan 1, 1984
10.321
+0.14
1.37%
jan 1, 1985
10.847
+0.526
5.1%
jan 1, 1986
10.973
+0.126
1.16%
jan 1, 1987
8.79
-2.183
-19.89%
jan 1, 1988
9.363
+0.573
6.52%
jan 1, 1989
9.056
-0.308
-3.29%
jan 1, 1990
8.958
-0.098
-1.08%
jan 1, 1991
8.159
-0.799
-8.91%
jan 1, 1992
6.894
-1.265
-15.5%
jan 1, 1993
7.813
+0.919
13.33%
jan 1, 1994
7.671
-0.142
-1.81%
jan 1, 1995
8.644
+0.973
12.68%
jan 1, 1996
9.145
+0.501
5.79%
jan 1, 1997
9.766
+0.621
6.79%
jan 1, 1998
10.002
+0.236
2.42%
jan 1, 1999
9.812
-0.19
-1.9%
jan 1, 2000
9.696
-0.116
-1.18%
jan 1, 2001
10.086
+0.39
4.02%
jan 1, 2002
10.37
+0.284
2.81%
jan 1, 2003
10.712
+0.342
3.3%
jan 1, 2004
11.948
+1.236
11.54%
jan 1, 2005
13.258
+1.31
10.96%
jan 1, 2006
14.141
+0.883
6.66%
jan 1, 2007
15.924
+1.783
12.61%
jan 1, 2008
17.519
+1.596
10.02%
jan 1, 2009
18.954
+1.434
8.19%
jan 1, 2010
19.127
+0.174
0.92%
jan 1, 2011
19.823
+0.696
3.64%
jan 1, 2012
20.993
+1.17
5.9%
jan 1, 2013
21.52
+0.527
2.51%
jan 1, 2014
21.741
+0.221
1.03%
jan 1, 2015
22.2
+0.459
2.11%
Ranking of countries by current statistics by years


Comments: