29
/
en
AIzaSyAYiBZKx7MnpbEhh9jyipgxe19OcubqV5w
April 1, 2024
161740
Italy
ITA
true
2
1
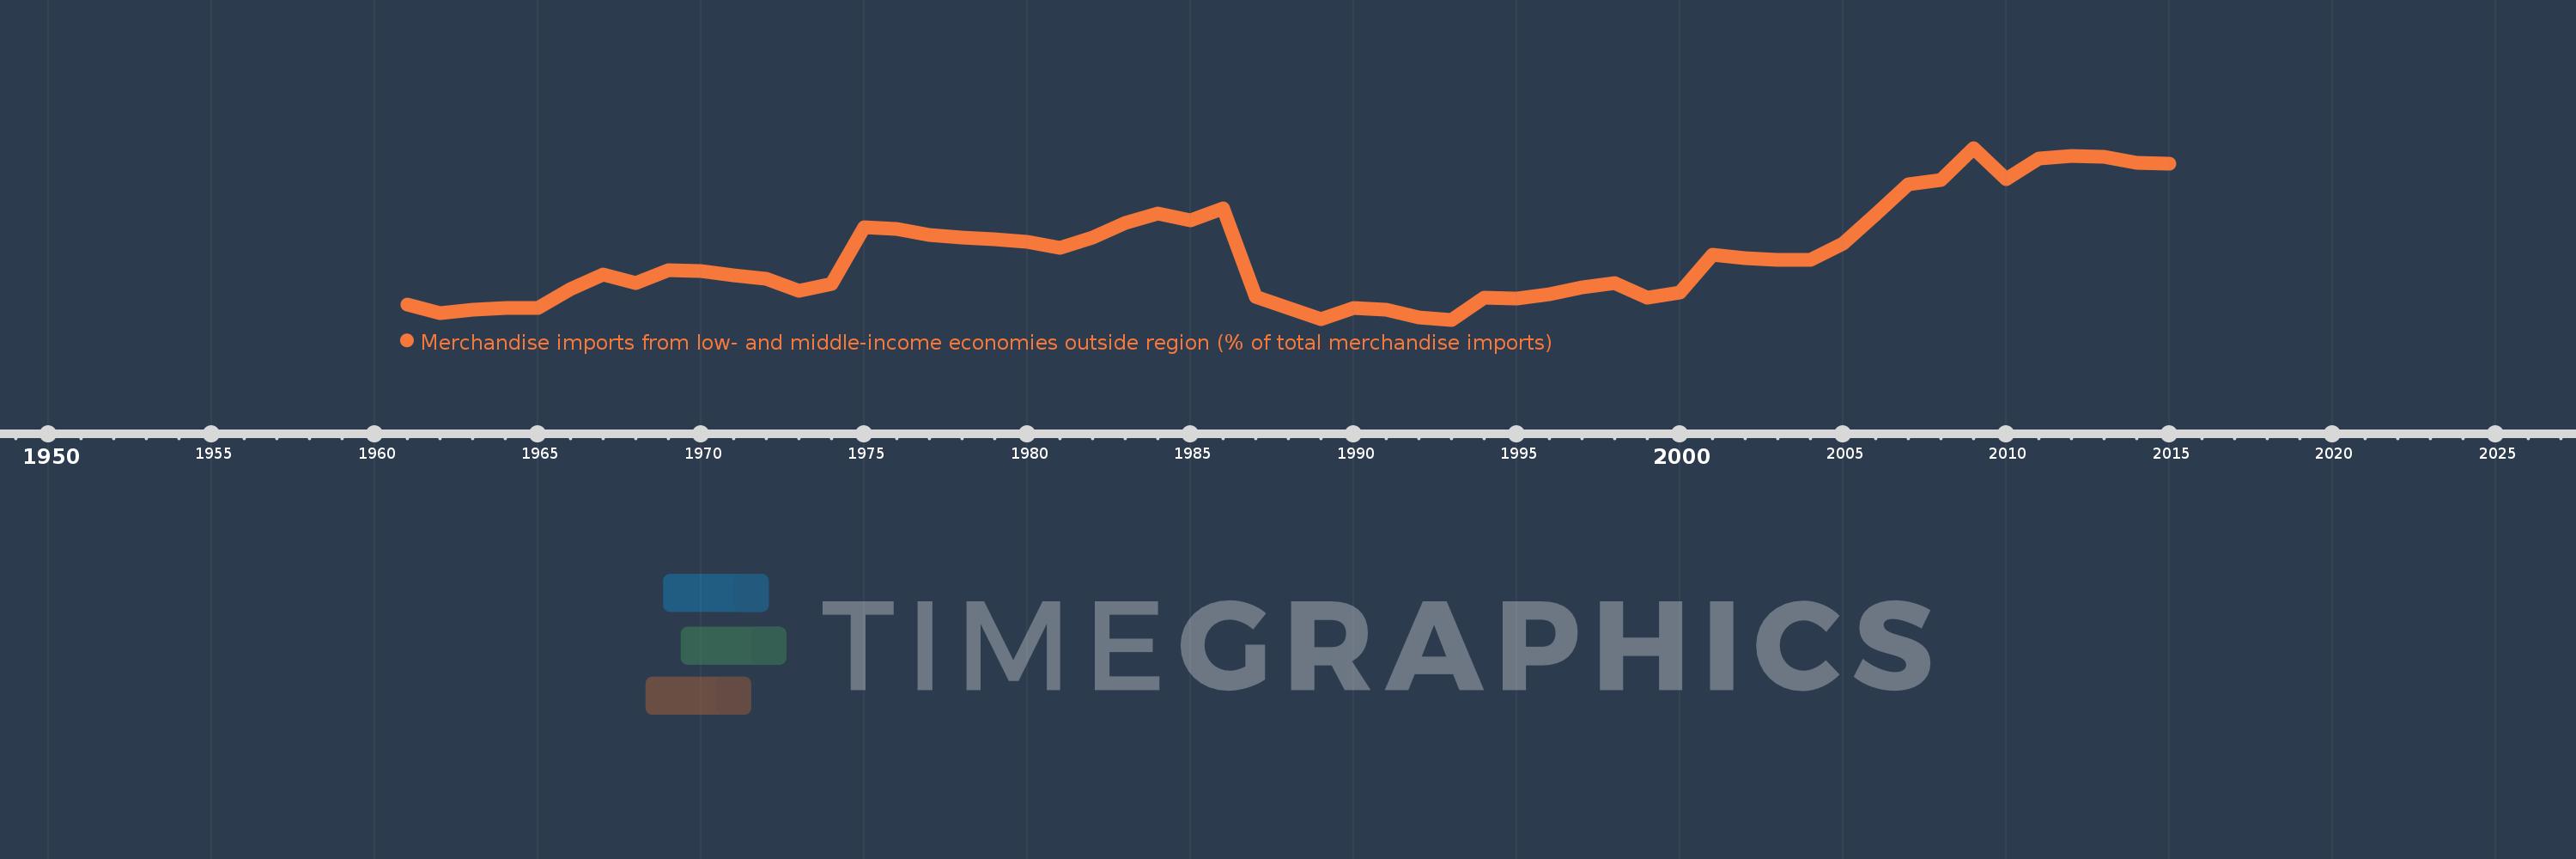
Merchandise imports from low- and middle-income economies outside region (% of total merchandise imports)
2015,2014,2013,2012,2011,2010,2009,2008,2007,2006,2005,2004,2003,2002,2001,2000,1999,1998,1997,1996,1995,1994,1993,1992,1991,1990,1989,1988,1987,1986,1985,1984,1983,1982,1981,1980,1979,1978,1977,1976,1975,1974,1973,1972,1971,1970,1969,1968,1967,1966,1965,1964,1963,1962,1961
This statistics in other country:
AfghanistanAlbaniaAlgeriaAngolaArab WorldArgentinaArmeniaArubaAustraliaAustriaAzerbaijanBahamas, TheBahrainBangladeshBarbadosBelarusBelgiumBelizeBeninBermudaBoliviaBrazilBrunei DarussalamBulgariaBurkina FasoBurundiCabo VerdeCambodiaCameroonCanadaCaribbean small statesCentral African RepublicCentral Europe and the BalticsChileChinaColombiaCongo, Dem. Rep.Congo, Rep.Costa RicaCote d'IvoireCroatiaCubaCyprusCzech RepublicDenmarkDominicaDominican RepublicEarly-demographic dividendEast Asia & PacificEast Asia & Pacific (excluding high income)East Asia & Pacific (IDA & IBRD countries)EcuadorEgypt, Arab Rep.El SalvadorEstoniaEthiopiaEuro areaEurope & Central AsiaEurope & Central Asia (excluding high income)Europe & Central Asia (IDA & IBRD countries)European UnionFijiFinlandFragile and conflict affected situationsFranceGabonGambia, TheGeorgiaGermanyGhanaGreeceGreenlandGrenadaGuatemalaGuineaGuyanaHaitiHeavily indebted poor countries (HIPC)High incomeHondurasHong Kong SAR, ChinaHungaryIBRD onlyIcelandIDA & IBRD totalIDA blendIDA onlyIDA totalIndiaIndonesiaIran, Islamic Rep.IraqIrelandIsraelItalyJamaicaJapanJordanKazakhstanKenyaKorea, Dem. People’s Rep.Korea, Rep.KuwaitKyrgyz RepublicLao PDRLate-demographic dividendLatin America & Caribbean Latin America & Caribbean (excluding high income)Latin America & the Caribbean (IDA & IBRD countries)LatviaLeast developed countries: UN classificationLebanonLiberiaLibyaLithuaniaLow & middle incomeLow incomeLower middle incomeLuxembourgMacao SAR, ChinaMacedonia, FYRMadagascarMalawiMalaysiaMaliMaltaMauritaniaMauritiusMexicoMiddle East & North AfricaMiddle East & North Africa (excluding high income)Middle East & North Africa (IDA & IBRD countries)Middle incomeMoldovaMongoliaMontenegroMoroccoMozambiqueMyanmarNetherlandsNew CaledoniaNew ZealandNicaraguaNigerNigeriaNorth AmericaNorwayOECD membersOmanOther small statesPacific island small statesPakistanPanamaPapua New GuineaParaguayPeruPhilippinesPolandPortugalPost-demographic dividendPre-demographic dividendQatarRomaniaRussian FederationRwandaSaudi ArabiaSenegalSerbiaSeychellesSierra LeoneSingaporeSlovak RepublicSloveniaSmall statesSomaliaSouth AfricaSouth AsiaSouth Asia (IDA & IBRD)SpainSri LankaSt. Kitts and NevisSt. LuciaSt. Vincent and the GrenadinesSub-Saharan Africa Sub-Saharan Africa (excluding high income)Sub-Saharan Africa (IDA & IBRD countries)SudanSurinameSwedenSwitzerlandSyrian Arab RepublicTanzaniaThailandTogoTrinidad and TobagoTunisiaTurkeyUgandaUkraineUnited Arab EmiratesUnited KingdomUnited StatesUpper middle incomeUruguayVenezuela, RBVietnamWorldYemen, Rep.ZambiaZimbabwe Timeline:
This timeline shows a graph from 1961 to 2015 of Italy. No data until 1960. Number of actual observations by date: 55.
Source name:
World Development Indicators
Source organization:
World Bank staff estimates based data from International Monetary Fund's Direction of Trade database.
Categories, topics:
Private Sector, Trade
Last updated:
apr 23, 2017
Indicators value changes by year
Minimum:
13.971
jan 1, 1993
Maximum:
29.038
jan 1, 2009
At the date of observation
Value
Absolute change
Change from previous value
jan 1, 1961
15.319
+15.319
0.0%
jan 1, 1962
14.582
-0.737
-4.81%
jan 1, 1963
14.881
+0.299
2.05%
jan 1, 1964
14.969
+0.088
0.59%
jan 1, 1965
14.966
-0.004
-0.02%
jan 1, 1966
16.663
+1.698
11.34%
jan 1, 1967
17.907
+1.244
7.47%
jan 1, 1968
17.197
-0.711
-3.97%
jan 1, 1969
18.333
+1.137
6.61%
jan 1, 1970
18.27
-0.063
-0.34%
jan 1, 1971
17.857
-0.413
-2.26%
jan 1, 1972
17.543
-0.314
-1.76%
jan 1, 1973
16.519
-1.024
-5.84%
jan 1, 1974
17.099
+0.58
3.51%
jan 1, 1975
22.093
+4.994
29.2%
jan 1, 1976
21.95
-0.143
-0.65%
jan 1, 1977
21.411
-0.539
-2.46%
jan 1, 1978
21.154
-0.257
-1.2%
jan 1, 1979
21.017
-0.136
-0.65%
jan 1, 1980
20.81
-0.207
-0.99%
jan 1, 1981
20.261
-0.549
-2.64%
jan 1, 1982
21.211
+0.95
4.69%
jan 1, 1983
22.497
+1.286
6.06%
jan 1, 1984
23.266
+0.769
3.42%
jan 1, 1985
22.713
-0.553
-2.38%
jan 1, 1986
23.744
+1.031
4.54%
jan 1, 1987
15.95
-7.794
-32.83%
jan 1, 1988
15.001
-0.949
-5.95%
jan 1, 1989
14.022
-0.979
-6.53%
jan 1, 1990
15.008
+0.986
7.03%
jan 1, 1991
14.877
-0.131
-0.88%
jan 1, 1992
14.188
-0.689
-4.63%
jan 1, 1993
13.971
-0.216
-1.53%
jan 1, 1994
15.917
+1.946
13.93%
jan 1, 1995
15.861
-0.056
-0.35%
jan 1, 1996
16.195
+0.334
2.1%
jan 1, 1997
16.848
+0.654
4.04%
jan 1, 1998
17.151
+0.302
1.79%
jan 1, 1999
15.934
-1.216
-7.09%
jan 1, 2000
16.369
+0.435
2.73%
jan 1, 2001
19.648
+3.279
20.03%
jan 1, 2002
19.401
-0.247
-1.26%
jan 1, 2003
19.186
-0.215
-1.11%
jan 1, 2004
19.254
+0.067
0.35%
jan 1, 2005
20.667
+1.414
7.34%
jan 1, 2006
23.227
+2.56
12.39%
jan 1, 2007
25.825
+2.598
11.19%
jan 1, 2008
26.252
+0.427
1.65%
jan 1, 2009
29.038
+2.786
10.61%
jan 1, 2010
26.335
-2.703
-9.31%
jan 1, 2011
28.102
+1.767
6.71%
jan 1, 2012
28.327
+0.225
0.8%
jan 1, 2013
28.261
-0.067
-0.23%
jan 1, 2014
27.753
-0.508
-1.8%
jan 1, 2015
27.67
-0.083
-0.3%
Ranking of countries by current statistics by years


Comments: