29
/
en
AIzaSyAYiBZKx7MnpbEhh9jyipgxe19OcubqV5w
April 1, 2024
165134
Jordan
JOR
true
2
1
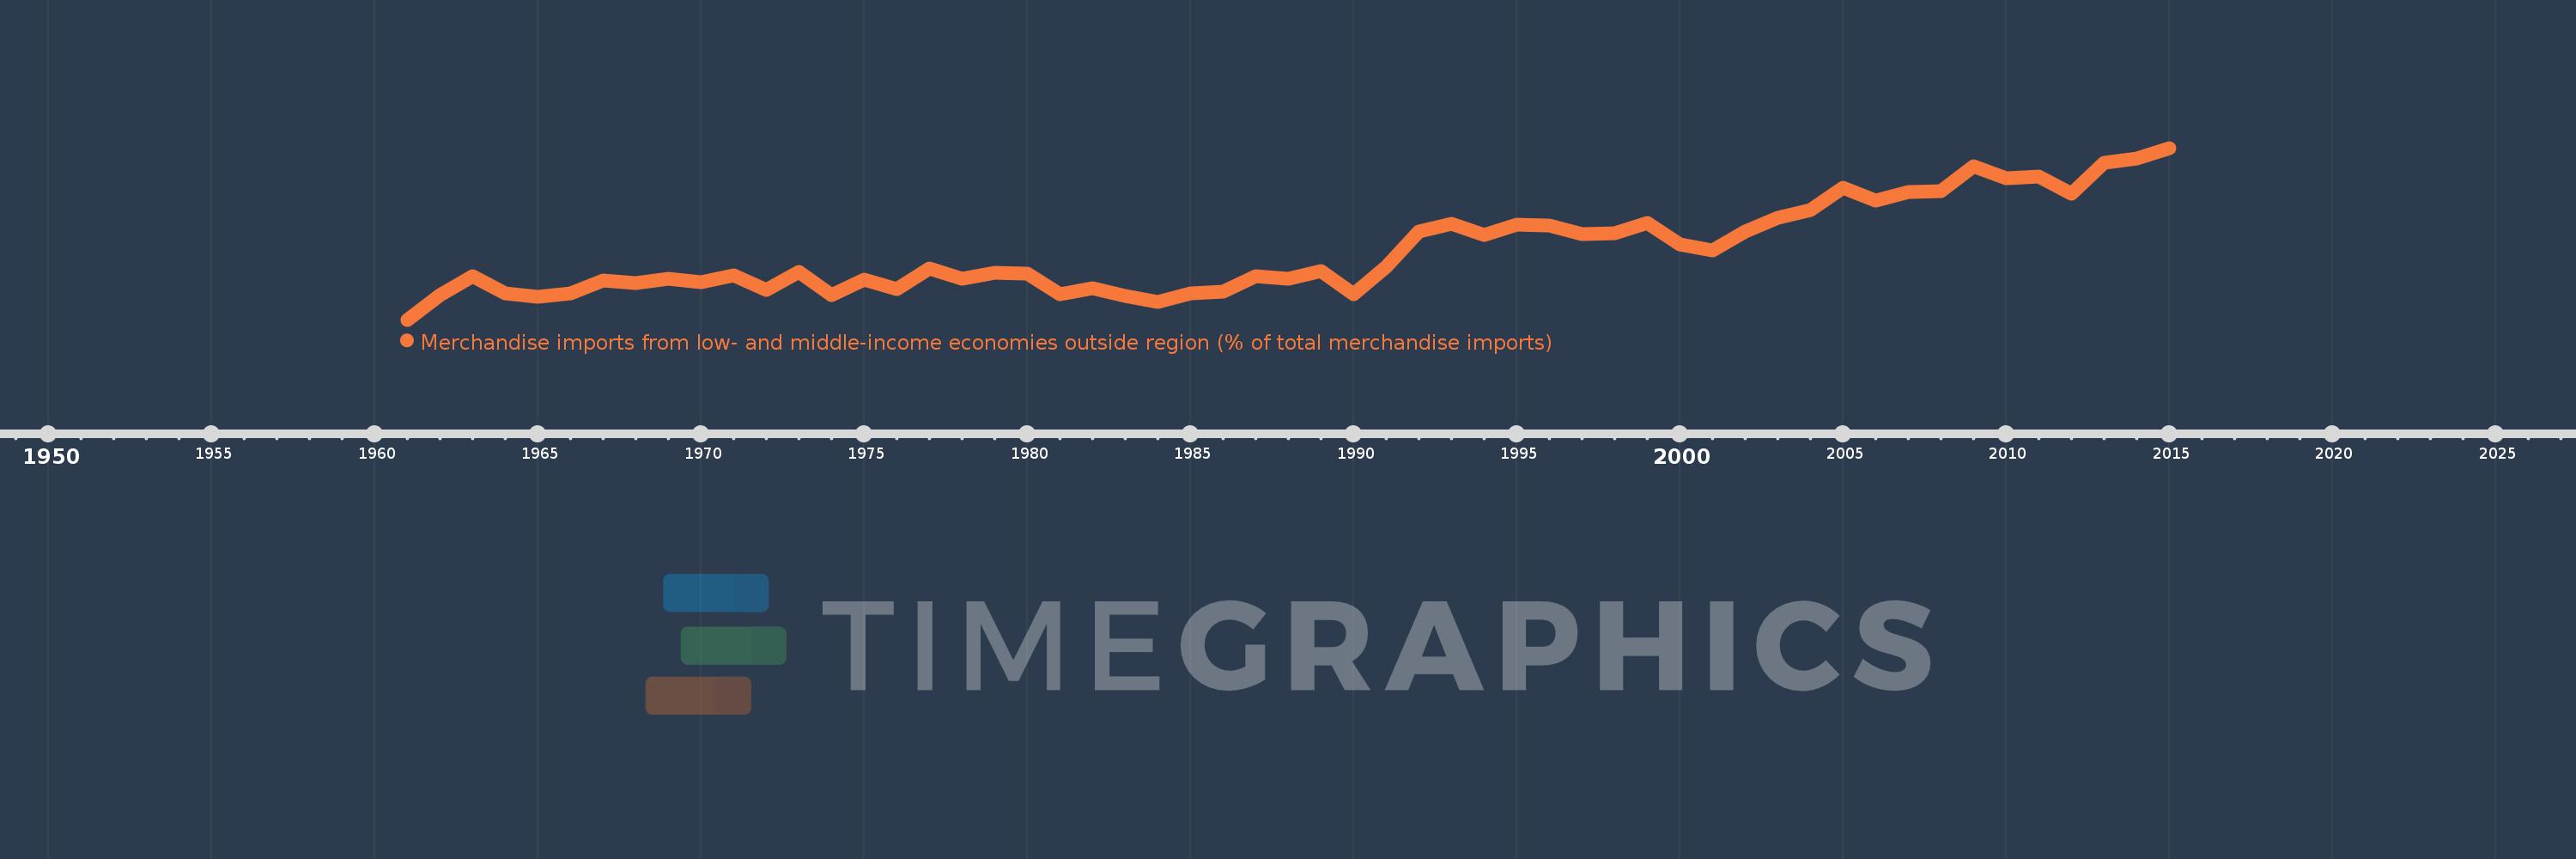
Merchandise imports from low- and middle-income economies outside region (% of total merchandise imports)
2015,2014,2013,2012,2011,2010,2009,2008,2007,2006,2005,2004,2003,2002,2001,2000,1999,1998,1997,1996,1995,1994,1993,1992,1991,1990,1989,1988,1987,1986,1985,1984,1983,1982,1981,1980,1979,1978,1977,1976,1975,1974,1973,1972,1971,1970,1969,1968,1967,1966,1965,1964,1963,1962,1961
This statistics in other country:
AfghanistanAlbaniaAlgeriaAngolaArab WorldArgentinaArmeniaArubaAustraliaAustriaAzerbaijanBahamas, TheBahrainBangladeshBarbadosBelarusBelgiumBelizeBeninBermudaBoliviaBrazilBrunei DarussalamBulgariaBurkina FasoBurundiCabo VerdeCambodiaCameroonCanadaCaribbean small statesCentral African RepublicCentral Europe and the BalticsChileChinaColombiaCongo, Dem. Rep.Congo, Rep.Costa RicaCote d'IvoireCroatiaCubaCyprusCzech RepublicDenmarkDominicaDominican RepublicEarly-demographic dividendEast Asia & PacificEast Asia & Pacific (excluding high income)East Asia & Pacific (IDA & IBRD countries)EcuadorEgypt, Arab Rep.El SalvadorEstoniaEthiopiaEuro areaEurope & Central AsiaEurope & Central Asia (excluding high income)Europe & Central Asia (IDA & IBRD countries)European UnionFijiFinlandFragile and conflict affected situationsFranceGabonGambia, TheGeorgiaGermanyGhanaGreeceGreenlandGrenadaGuatemalaGuineaGuyanaHaitiHeavily indebted poor countries (HIPC)High incomeHondurasHong Kong SAR, ChinaHungaryIBRD onlyIcelandIDA & IBRD totalIDA blendIDA onlyIDA totalIndiaIndonesiaIran, Islamic Rep.IraqIrelandIsraelItalyJamaicaJapanJordanKazakhstanKenyaKorea, Dem. People’s Rep.Korea, Rep.KuwaitKyrgyz RepublicLao PDRLate-demographic dividendLatin America & Caribbean Latin America & Caribbean (excluding high income)Latin America & the Caribbean (IDA & IBRD countries)LatviaLeast developed countries: UN classificationLebanonLiberiaLibyaLithuaniaLow & middle incomeLow incomeLower middle incomeLuxembourgMacao SAR, ChinaMacedonia, FYRMadagascarMalawiMalaysiaMaliMaltaMauritaniaMauritiusMexicoMiddle East & North AfricaMiddle East & North Africa (excluding high income)Middle East & North Africa (IDA & IBRD countries)Middle incomeMoldovaMongoliaMontenegroMoroccoMozambiqueMyanmarNetherlandsNew CaledoniaNew ZealandNicaraguaNigerNigeriaNorth AmericaNorwayOECD membersOmanOther small statesPacific island small statesPakistanPanamaPapua New GuineaParaguayPeruPhilippinesPolandPortugalPost-demographic dividendPre-demographic dividendQatarRomaniaRussian FederationRwandaSaudi ArabiaSenegalSerbiaSeychellesSierra LeoneSingaporeSlovak RepublicSloveniaSmall statesSomaliaSouth AfricaSouth AsiaSouth Asia (IDA & IBRD)SpainSri LankaSt. Kitts and NevisSt. LuciaSt. Vincent and the GrenadinesSub-Saharan Africa Sub-Saharan Africa (excluding high income)Sub-Saharan Africa (IDA & IBRD countries)SudanSurinameSwedenSwitzerlandSyrian Arab RepublicTanzaniaThailandTogoTrinidad and TobagoTunisiaTurkeyUgandaUkraineUnited Arab EmiratesUnited KingdomUnited StatesUpper middle incomeUruguayVenezuela, RBVietnamWorldYemen, Rep.ZambiaZimbabwe Timeline:
This timeline shows a graph from 1961 to 2015 of Jordan. No data until 1960. Number of actual observations by date: 55.
Source name:
World Development Indicators
Source organization:
World Bank staff estimates based data from International Monetary Fund's Direction of Trade database.
Categories, topics:
Private Sector, Trade
Last updated:
apr 23, 2017
Indicators value changes by year
At the date of observation
Value
Absolute change
Change from previous value
jan 1, 1961
4.254
+4.254
0.0%
jan 1, 1962
7.811
+3.558
83.64%
jan 1, 1963
10.585
+2.773
35.51%
jan 1, 1964
8.079
-2.505
-23.67%
jan 1, 1965
7.62
-0.459
-5.68%
jan 1, 1966
8.099
+0.479
6.29%
jan 1, 1967
9.887
+1.787
22.06%
jan 1, 1968
9.552
-0.335
-3.38%
jan 1, 1969
10.132
+0.58
6.07%
jan 1, 1970
9.713
-0.419
-4.14%
jan 1, 1971
10.679
+0.966
9.94%
jan 1, 1972
8.496
-2.182
-20.44%
jan 1, 1973
11.132
+2.636
31.02%
jan 1, 1974
7.769
-3.363
-30.21%
jan 1, 1975
10.069
+2.3
29.6%
jan 1, 1976
8.62
-1.449
-14.39%
jan 1, 1977
11.698
+3.078
35.71%
jan 1, 1978
10.204
-1.495
-12.78%
jan 1, 1979
11.033
+0.829
8.13%
jan 1, 1980
10.874
-0.159
-1.44%
jan 1, 1981
7.899
-2.976
-27.36%
jan 1, 1982
8.815
+0.916
11.6%
jan 1, 1983
7.634
-1.18
-13.39%
jan 1, 1984
6.79
-0.845
-11.06%
jan 1, 1985
8.098
+1.309
19.27%
jan 1, 1986
8.286
+0.187
2.31%
jan 1, 1987
10.601
+2.315
27.94%
jan 1, 1988
10.184
-0.417
-3.94%
jan 1, 1989
11.271
+1.087
10.68%
jan 1, 1990
7.897
-3.374
-29.94%
jan 1, 1991
11.847
+3.951
50.03%
jan 1, 1992
16.984
+5.136
43.35%
jan 1, 1993
18.132
+1.148
6.76%
jan 1, 1994
16.455
-1.676
-9.25%
jan 1, 1995
17.971
+1.516
9.21%
jan 1, 1996
17.919
-0.052
-0.29%
jan 1, 1997
16.64
-1.279
-7.14%
jan 1, 1998
16.726
+0.086
0.52%
jan 1, 1999
18.243
+1.517
9.07%
jan 1, 2000
15.141
-3.102
-17.0%
jan 1, 2001
14.322
-0.82
-5.41%
jan 1, 2002
17.049
+2.728
19.05%
jan 1, 2003
19.015
+1.965
11.53%
jan 1, 2004
20.146
+1.131
5.95%
jan 1, 2005
23.362
+3.216
15.96%
jan 1, 2006
21.415
-1.947
-8.33%
jan 1, 2007
22.651
+1.236
5.77%
jan 1, 2008
22.783
+0.132
0.58%
jan 1, 2009
26.398
+3.614
15.86%
jan 1, 2010
24.704
-1.694
-6.42%
jan 1, 2011
24.944
+0.24
0.97%
jan 1, 2012
22.45
-2.494
-10.0%
jan 1, 2013
26.869
+4.419
19.68%
jan 1, 2014
27.586
+0.717
2.67%
jan 1, 2015
29.06
+1.474
5.34%
Ranking of countries by current statistics by years


Comments: