29
/
en
AIzaSyAYiBZKx7MnpbEhh9jyipgxe19OcubqV5w
April 1, 2024
55721
Pre-demographic dividend
PRE
false
2
1
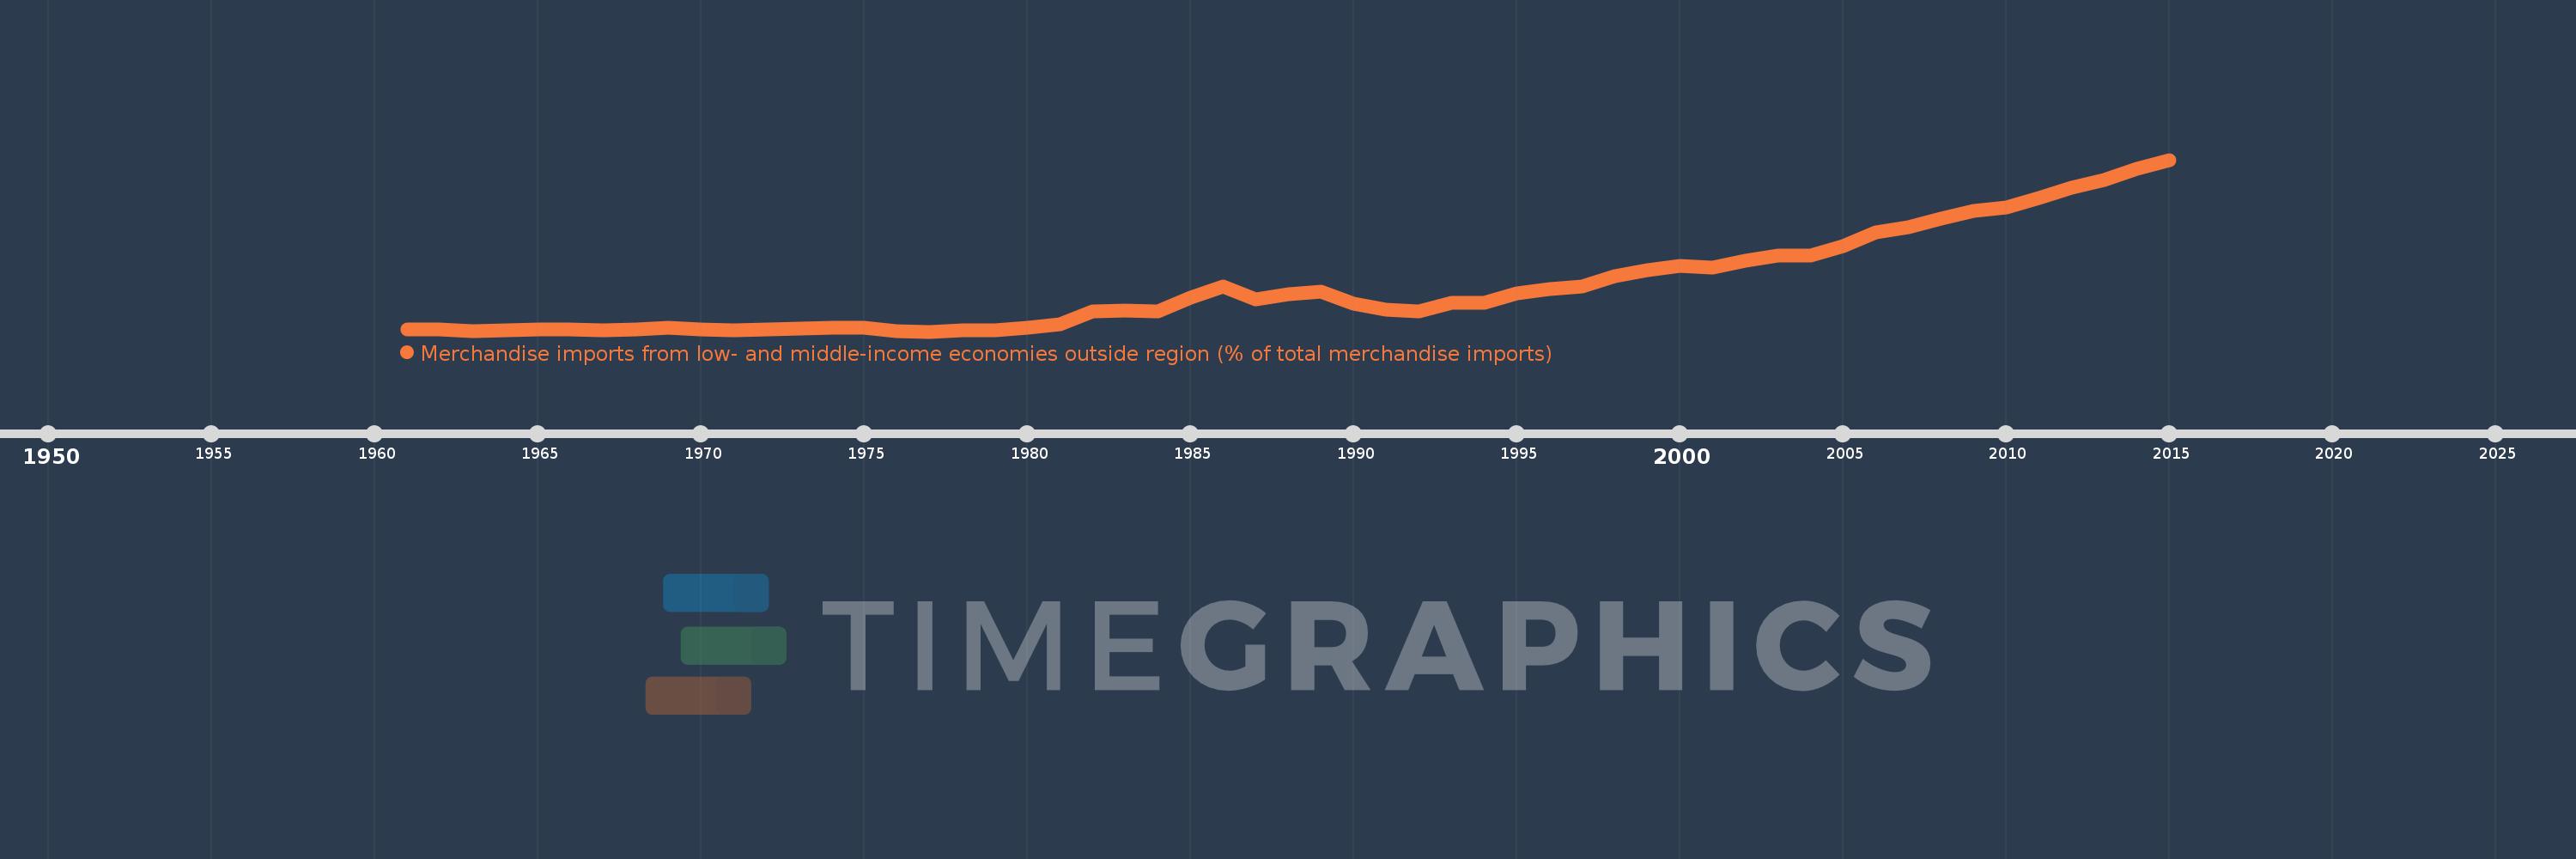
Merchandise imports from low- and middle-income economies outside region (% of total merchandise imports)
2015,2014,2013,2012,2011,2010,2009,2008,2007,2006,2005,2004,2003,2002,2001,2000,1999,1998,1997,1996,1995,1994,1993,1992,1991,1990,1989,1988,1987,1986,1985,1984,1983,1982,1981,1980,1979,1978,1977,1976,1975,1974,1973,1972,1971,1970,1969,1968,1967,1966,1965,1964,1963,1962,1961
This statistics in other country:
AfghanistanAlbaniaAlgeriaAngolaArab WorldArgentinaArmeniaArubaAustraliaAustriaAzerbaijanBahamas, TheBahrainBangladeshBarbadosBelarusBelgiumBelizeBeninBermudaBoliviaBrazilBrunei DarussalamBulgariaBurkina FasoBurundiCabo VerdeCambodiaCameroonCanadaCaribbean small statesCentral African RepublicCentral Europe and the BalticsChileChinaColombiaCongo, Dem. Rep.Congo, Rep.Costa RicaCote d'IvoireCroatiaCubaCyprusCzech RepublicDenmarkDominicaDominican RepublicEarly-demographic dividendEast Asia & PacificEast Asia & Pacific (excluding high income)East Asia & Pacific (IDA & IBRD countries)EcuadorEgypt, Arab Rep.El SalvadorEstoniaEthiopiaEuro areaEurope & Central AsiaEurope & Central Asia (excluding high income)Europe & Central Asia (IDA & IBRD countries)European UnionFijiFinlandFragile and conflict affected situationsFranceGabonGambia, TheGeorgiaGermanyGhanaGreeceGreenlandGrenadaGuatemalaGuineaGuyanaHaitiHeavily indebted poor countries (HIPC)High incomeHondurasHong Kong SAR, ChinaHungaryIBRD onlyIcelandIDA & IBRD totalIDA blendIDA onlyIDA totalIndiaIndonesiaIran, Islamic Rep.IraqIrelandIsraelItalyJamaicaJapanJordanKazakhstanKenyaKorea, Dem. People’s Rep.Korea, Rep.KuwaitKyrgyz RepublicLao PDRLate-demographic dividendLatin America & Caribbean Latin America & Caribbean (excluding high income)Latin America & the Caribbean (IDA & IBRD countries)LatviaLeast developed countries: UN classificationLebanonLiberiaLibyaLithuaniaLow & middle incomeLow incomeLower middle incomeLuxembourgMacao SAR, ChinaMacedonia, FYRMadagascarMalawiMalaysiaMaliMaltaMauritaniaMauritiusMexicoMiddle East & North AfricaMiddle East & North Africa (excluding high income)Middle East & North Africa (IDA & IBRD countries)Middle incomeMoldovaMongoliaMontenegroMoroccoMozambiqueMyanmarNetherlandsNew CaledoniaNew ZealandNicaraguaNigerNigeriaNorth AmericaNorwayOECD membersOmanOther small statesPacific island small statesPakistanPanamaPapua New GuineaParaguayPeruPhilippinesPolandPortugalPost-demographic dividendPre-demographic dividendQatarRomaniaRussian FederationRwandaSaudi ArabiaSenegalSerbiaSeychellesSierra LeoneSingaporeSlovak RepublicSloveniaSmall statesSomaliaSouth AfricaSouth AsiaSouth Asia (IDA & IBRD)SpainSri LankaSt. Kitts and NevisSt. LuciaSt. Vincent and the GrenadinesSub-Saharan Africa Sub-Saharan Africa (excluding high income)Sub-Saharan Africa (IDA & IBRD countries)SudanSurinameSwedenSwitzerlandSyrian Arab RepublicTanzaniaThailandTogoTrinidad and TobagoTunisiaTurkeyUgandaUkraineUnited Arab EmiratesUnited KingdomUnited StatesUpper middle incomeUruguayVenezuela, RBVietnamWorldYemen, Rep.ZambiaZimbabwe Timeline:
This timeline shows a graph from 1961 to 2015 of Pre-demographic dividend. No data until 1960. Number of actual observations by date: 55.
Source name:
World Development Indicators
Source organization:
World Bank staff estimates based data from International Monetary Fund's Direction of Trade database.
Categories, topics:
Private Sector, Trade
Last updated:
apr 23, 2017
Indicators value changes by year
Maximum:
39.011
jan 1, 2015
At the date of observation
Value
Absolute change
Change from previous value
jan 1, 1961
0.875
+0.875
0.0%
jan 1, 1962
0.829
-0.046
-5.23%
jan 1, 1963
0.507
-0.322
-38.84%
jan 1, 1964
0.773
+0.267
52.59%
jan 1, 1965
0.841
+0.067
8.69%
jan 1, 1966
0.861
+0.02
2.4%
jan 1, 1967
0.737
-0.124
-14.42%
jan 1, 1968
0.89
+0.153
20.75%
jan 1, 1969
1.169
+0.28
31.42%
jan 1, 1970
0.809
-0.36
-30.81%
jan 1, 1971
0.666
-0.143
-17.63%
jan 1, 1972
0.811
+0.144
21.64%
jan 1, 1973
1.053
+0.242
29.91%
jan 1, 1974
1.239
+0.186
17.68%
jan 1, 1975
1.277
+0.038
3.03%
jan 1, 1976
0.408
-0.869
-68.08%
jan 1, 1977
0.39
-0.018
-4.41%
jan 1, 1978
0.599
+0.21
53.81%
jan 1, 1979
0.647
+0.048
8.03%
jan 1, 1980
1.174
+0.526
81.33%
jan 1, 1981
1.971
+0.797
67.91%
jan 1, 1982
4.879
+2.908
147.56%
jan 1, 1983
5.149
+0.27
5.54%
jan 1, 1984
4.913
-0.236
-4.59%
jan 1, 1985
8.106
+3.194
65.01%
jan 1, 1986
10.611
+2.504
30.89%
jan 1, 1987
7.691
-2.919
-27.51%
jan 1, 1988
8.738
+1.047
13.61%
jan 1, 1989
9.29
+0.552
6.31%
jan 1, 1990
6.574
-2.716
-29.24%
jan 1, 1991
5.223
-1.351
-20.55%
jan 1, 1992
4.98
-0.243
-4.65%
jan 1, 1993
6.781
+1.801
36.17%
jan 1, 1994
6.844
+0.063
0.93%
jan 1, 1995
9.014
+2.17
31.71%
jan 1, 1996
9.885
+0.87
9.66%
jan 1, 1997
10.493
+0.608
6.15%
jan 1, 1998
12.799
+2.306
21.98%
jan 1, 1999
14.14
+1.341
10.48%
jan 1, 2000
15.168
+1.028
7.27%
jan 1, 2001
14.835
-0.333
-2.19%
jan 1, 2002
16.261
+1.426
9.61%
jan 1, 2003
17.555
+1.294
7.96%
jan 1, 2004
17.521
-0.034
-0.19%
jan 1, 2005
19.611
+2.09
11.93%
jan 1, 2006
22.621
+3.01
15.35%
jan 1, 2007
23.92
+1.3
5.75%
jan 1, 2008
25.772
+1.852
7.74%
jan 1, 2009
27.553
+1.781
6.91%
jan 1, 2010
28.305
+0.753
2.73%
jan 1, 2011
30.412
+2.106
7.44%
jan 1, 2012
32.675
+2.263
7.44%
jan 1, 2013
34.453
+1.778
5.44%
jan 1, 2014
36.923
+2.47
7.17%
jan 1, 2015
39.011
+2.088
5.65%
Ranking of countries by current statistics by years


Comments: