29
/
en
AIzaSyAYiBZKx7MnpbEhh9jyipgxe19OcubqV5w
April 1, 2024
28348
East Asia & Pacific (excluding high income)
EAP
false
2
1
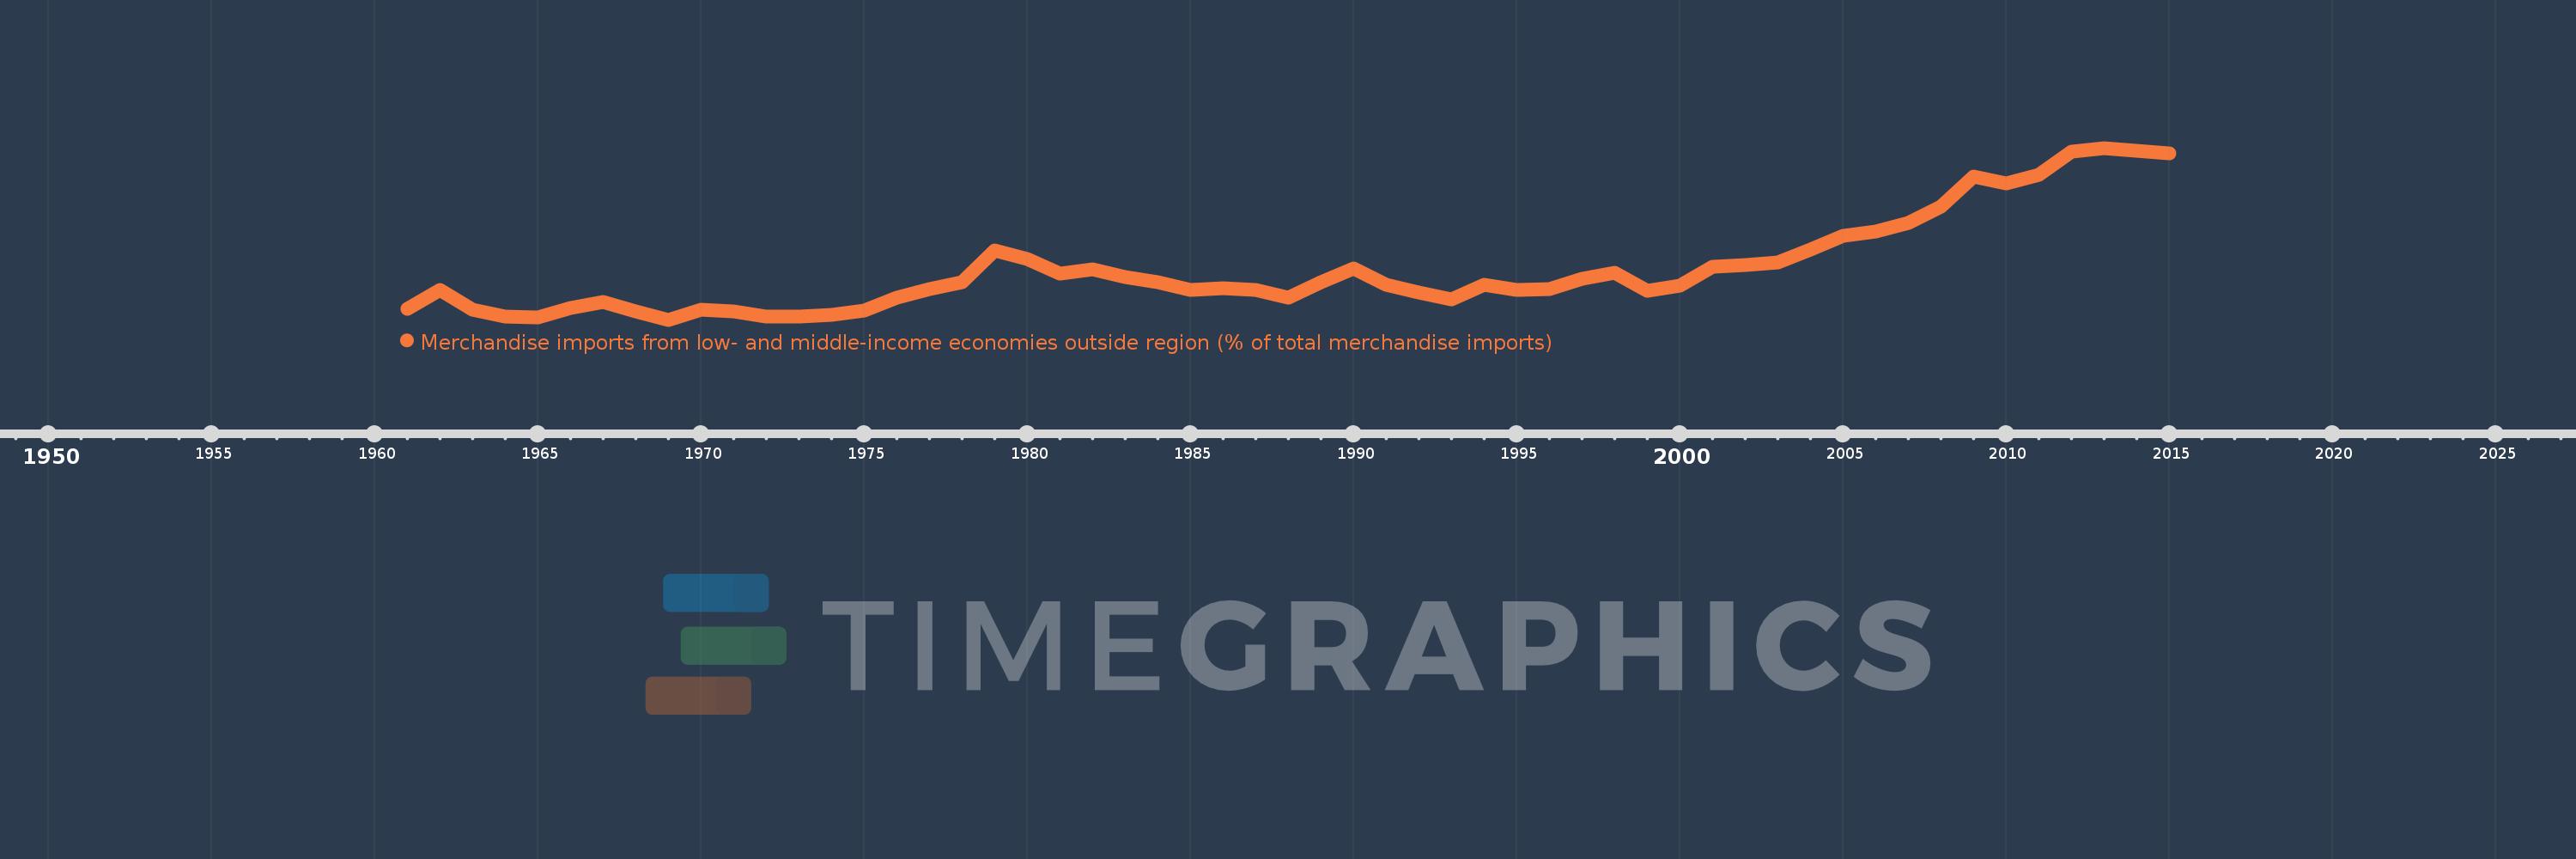
Merchandise imports from low- and middle-income economies outside region (% of total merchandise imports)
2015,2014,2013,2012,2011,2010,2009,2008,2007,2006,2005,2004,2003,2002,2001,2000,1999,1998,1997,1996,1995,1994,1993,1992,1991,1990,1989,1988,1987,1986,1985,1984,1983,1982,1981,1980,1979,1978,1977,1976,1975,1974,1973,1972,1971,1970,1969,1968,1967,1966,1965,1964,1963,1962,1961
This statistics in other country:
AfghanistanAlbaniaAlgeriaAngolaArab WorldArgentinaArmeniaArubaAustraliaAustriaAzerbaijanBahamas, TheBahrainBangladeshBarbadosBelarusBelgiumBelizeBeninBermudaBoliviaBrazilBrunei DarussalamBulgariaBurkina FasoBurundiCabo VerdeCambodiaCameroonCanadaCaribbean small statesCentral African RepublicCentral Europe and the BalticsChileChinaColombiaCongo, Dem. Rep.Congo, Rep.Costa RicaCote d'IvoireCroatiaCubaCyprusCzech RepublicDenmarkDominicaDominican RepublicEarly-demographic dividendEast Asia & PacificEast Asia & Pacific (excluding high income)East Asia & Pacific (IDA & IBRD countries)EcuadorEgypt, Arab Rep.El SalvadorEstoniaEthiopiaEuro areaEurope & Central AsiaEurope & Central Asia (excluding high income)Europe & Central Asia (IDA & IBRD countries)European UnionFijiFinlandFragile and conflict affected situationsFranceGabonGambia, TheGeorgiaGermanyGhanaGreeceGreenlandGrenadaGuatemalaGuineaGuyanaHaitiHeavily indebted poor countries (HIPC)High incomeHondurasHong Kong SAR, ChinaHungaryIBRD onlyIcelandIDA & IBRD totalIDA blendIDA onlyIDA totalIndiaIndonesiaIran, Islamic Rep.IraqIrelandIsraelItalyJamaicaJapanJordanKazakhstanKenyaKorea, Dem. People’s Rep.Korea, Rep.KuwaitKyrgyz RepublicLao PDRLate-demographic dividendLatin America & Caribbean Latin America & Caribbean (excluding high income)Latin America & the Caribbean (IDA & IBRD countries)LatviaLeast developed countries: UN classificationLebanonLiberiaLibyaLithuaniaLow & middle incomeLow incomeLower middle incomeLuxembourgMacao SAR, ChinaMacedonia, FYRMadagascarMalawiMalaysiaMaliMaltaMauritaniaMauritiusMexicoMiddle East & North AfricaMiddle East & North Africa (excluding high income)Middle East & North Africa (IDA & IBRD countries)Middle incomeMoldovaMongoliaMontenegroMoroccoMozambiqueMyanmarNetherlandsNew CaledoniaNew ZealandNicaraguaNigerNigeriaNorth AmericaNorwayOECD membersOmanOther small statesPacific island small statesPakistanPanamaPapua New GuineaParaguayPeruPhilippinesPolandPortugalPost-demographic dividendPre-demographic dividendQatarRomaniaRussian FederationRwandaSaudi ArabiaSenegalSerbiaSeychellesSierra LeoneSingaporeSlovak RepublicSloveniaSmall statesSomaliaSouth AfricaSouth AsiaSouth Asia (IDA & IBRD)SpainSri LankaSt. Kitts and NevisSt. LuciaSt. Vincent and the GrenadinesSub-Saharan Africa Sub-Saharan Africa (excluding high income)Sub-Saharan Africa (IDA & IBRD countries)SudanSurinameSwedenSwitzerlandSyrian Arab RepublicTanzaniaThailandTogoTrinidad and TobagoTunisiaTurkeyUgandaUkraineUnited Arab EmiratesUnited KingdomUnited StatesUpper middle incomeUruguayVenezuela, RBVietnamWorldYemen, Rep.ZambiaZimbabwe Timeline:
This timeline shows a graph from 1961 to 2015 of East Asia & Pacific (excluding high income). No data until 1960. Number of actual observations by date: 55.
Source name:
World Development Indicators
Source organization:
World Bank staff estimates based data from International Monetary Fund's Direction of Trade database.
Categories, topics:
Private Sector, Trade
Last updated:
apr 23, 2017
Indicators value changes by year
Maximum:
12.785
jan 1, 2013
At the date of observation
Value
Absolute change
Change from previous value
jan 1, 1961
2.906
+2.906
0.0%
jan 1, 1962
4.081
+1.176
40.47%
jan 1, 1963
2.902
-1.179
-28.9%
jan 1, 1964
2.439
-0.463
-15.95%
jan 1, 1965
2.408
-0.031
-1.28%
jan 1, 1966
2.994
+0.586
24.32%
jan 1, 1967
3.355
+0.361
12.05%
jan 1, 1968
2.775
-0.58
-17.28%
jan 1, 1969
2.264
-0.511
-18.41%
jan 1, 1970
2.865
+0.601
26.55%
jan 1, 1971
2.798
-0.068
-2.36%
jan 1, 1972
2.461
-0.337
-12.04%
jan 1, 1973
2.434
-0.027
-1.09%
jan 1, 1974
2.572
+0.138
5.68%
jan 1, 1975
2.809
+0.236
9.19%
jan 1, 1976
3.639
+0.831
29.58%
jan 1, 1977
4.143
+0.504
13.85%
jan 1, 1978
4.556
+0.412
9.95%
jan 1, 1979
6.499
+1.944
42.66%
jan 1, 1980
5.999
-0.501
-7.71%
jan 1, 1981
5.064
-0.934
-15.57%
jan 1, 1982
5.372
+0.307
6.07%
jan 1, 1983
4.853
-0.519
-9.66%
jan 1, 1984
4.556
-0.297
-6.12%
jan 1, 1985
4.095
-0.461
-10.11%
jan 1, 1986
4.203
+0.107
2.62%
jan 1, 1987
4.076
-0.127
-3.03%
jan 1, 1988
3.635
-0.441
-10.82%
jan 1, 1989
4.565
+0.931
25.61%
jan 1, 1990
5.384
+0.819
17.93%
jan 1, 1991
4.431
-0.953
-17.7%
jan 1, 1992
3.93
-0.501
-11.31%
jan 1, 1993
3.527
-0.403
-10.25%
jan 1, 1994
4.4
+0.873
24.76%
jan 1, 1995
4.085
-0.316
-7.18%
jan 1, 1996
4.168
+0.084
2.05%
jan 1, 1997
4.793
+0.624
14.98%
jan 1, 1998
5.149
+0.356
7.42%
jan 1, 1999
4.012
-1.137
-22.09%
jan 1, 2000
4.364
+0.352
8.78%
jan 1, 2001
5.526
+1.163
26.64%
jan 1, 2002
5.609
+0.082
1.49%
jan 1, 2003
5.792
+0.184
3.28%
jan 1, 2004
6.558
+0.766
13.23%
jan 1, 2005
7.387
+0.828
12.63%
jan 1, 2006
7.675
+0.288
3.9%
jan 1, 2007
8.211
+0.536
6.98%
jan 1, 2008
9.198
+0.987
12.02%
jan 1, 2009
11.052
+1.853
20.15%
jan 1, 2010
10.596
-0.456
-4.12%
jan 1, 2011
11.14
+0.543
5.13%
jan 1, 2012
12.545
+1.405
12.61%
jan 1, 2013
12.785
+0.241
1.92%
jan 1, 2014
12.618
-0.167
-1.31%
jan 1, 2015
12.443
-0.175
-1.39%
Ranking of countries by current statistics by years


Comments: